Introduction
This website gathers all teaching materials for the students of Sciences Po Paris School of Public Affairs and Sciences Po Paris Urban School Master Governing Ecological Transitions in Cities attending the class The futures of digital systems within the environmental crisis.
Teaching materials have been created by Gauthier Roussilhe and David Ekchajzer from Hubblo, a leading research company on the environmental impacts of digitalization.
Course description
Firstly, a general overview of the materiality of digital infrastructures will be presented, both through field observation and lectures. The aim is to provide a solid foundation of what is needed to manufacture, deploy, use and dispose of digital systems. The specific changes that AI is bringing to the materiality of the ICT value chain will be the subject of a dedicated session. Secondly, we will examine how to manage the environmental impacts of the digital sector through assessment approaches at multiple scales. This aims at giving students a literacy that will help them navigate complex discourses. Thirdly, the course will explore possible futures for ICT in a sustainable world. Case studies will be delivered through lectures, serious games and by the students through their collective projects. This last part aims at providing students with strategic and planning capabilities regarding digitalization in an increasingly constrained world.
Course structure
This course consists of 12 two-hour sessions, which will take place throughout the first half of the year.
The course is structured around four types of activities:
- Sessions: Knowledge transmission focused on a specific aspect of the environmental impact of digitalisation
- Case studies: An examination of the effects of digitalisation on environmental transitions in a specific location
- Activities: Individual and group activities designed to help you explore the environmental materiality of digitalisation** and its consequences
- Evaluation: Individual and group activities that contribute to the final course validation
This book contains all the course materials. As the sessions are designed to be as interactive as possible, you are encouraged to skim through the relevant material before each session.
Assessment mode
The course will be assessed through three components. First, students will work on two collective projects. Drawing on the theoretical and practical knowledge acquired during the course, students will assess the environmental impacts of a given infrastructure (Collective project #1) and digital technology deployed in a specific context (Collective project #2), and examine their compatibility with environmental transition policies.
Second, students will write a short individual essay (2 pages maximum). Finally, participation and engagement will also be accounted for in the final grade.
| Assessment | Points |
|---|---|
| Collective project #1 : Datacenter environmental inquiry | 7 |
| Collective project #2 : Indirect effects inquiry | 7 |
| Individual essay | 4 |
| Participation | 2 |
| Total | 20 |
Teacher contact
For Urban School: Gauthier Roussilhe (gauthier.roussilhe@hubblo.org)
For School of Public Affairs: David Ekchajzer (da.ekchajzer@hubblo.org)
Licence

This work is made available under the terms of the Creative Commons Attribution - Noncommercial - Share Alike 4.0 International License.
Sessions
- I - Sociotechnical imaginaries
- II - Telecom infrastructures
- III - Data centers
- IV - End-user devices
- V - Extraction
- VI - Processing
- VII - Manufacturing
- VII - End of Life
- IX - Environmental footprint of ICT
- X - Indirect effects
- XI - GenAI/AI acceleration
Session 1 : Sociotechnical imaginaries
Important
What are you interested in this topic? What are your expectations?
Why looking at the environmental crisis and digitalization simultaneously?
The ongoing environmental crisis and digitalization are two global phenomena that are deeply modifying human activities. We know today that the environmental crisis is the result of industrial transformations led in England at the beginning of the 19th century and that will later spread in Western Europe, Northern America and East Asia at the end of the 20th century. So it’s not Humanity that is responsible but a specific set of societies and efforts to adapt should be distributed accordingly. Furthermore, consequences of the environmental crisis will not be distributed fairly: countries that relied the most on fossil energy for their development will be the ones that would be better suited to adapt and be less impacted. Faced with this situation, we need to be very careful where we want to steer future developments of human activities so they can be sustainable and fairly distributed.
Digitalization is viewed as the next step for economic and technological developments, that could also help move towards ecological transition. Under the hood of digitalization can be found a mix of buzzwords and technological jargon: Artificial Intelligence (AI), Machine Learning (ML), blockchains, autonomous vehicles, smart cities, metaverse, etc, that makes it hard to sort out the significant from the irrelevant. Electronic communications and computing largely change the way we operate industry, research, businesses, public services and even our ways of life. Digitalization accelerated certain activities, transformed all sectors, destroyed others. But does digitalization accelerates activites that provoked / are amplifying the ongoing crisis or is it one of the keys to unlock more sustainable, fair and resilient societies, or both?

This fundamental tension between the environmental crisis and digitalization is at the heart of this course. While the scientific community is starting to better understand the environmental footprint of digitalization, it is highly unclear if digitalization, as a whole, has a positive impact and in which conditions it can be fostered. This tension can be somehow visible in the lastest IPCC’s WGIII report :
At present, the understanding of both the direct and indirect impacts of digitalisation on energy use, carbon emissions and potential mitigation is limited (medium confidence). (Technical Summary, p.132)
This statement is elaborated in the summary for policymakers:
Digital technologies can contribute to mitigation of climate change and the achievement of several SDGs (high confidence). For example, sensors, Internet of Things, robotics, and artificial intelligence can improve energy management in all sectors, increase energy efficiency, and promote the adoption of many low-emission technologies, including decentralised renewable energy, while creating economic opportunities (high confidence). However, some of these climate change mitigation gains can be reduced or counterbalanced by growth in demand for goods and services due to the use of digital devices (high confidence). Digitalisation can involve trade-offs across several SDGs, e.g., increasing electronic waste, negative impacts on labour markets, and exacerbating the existing digital divide. Digital technology supports decarbonisation only if appropriately governed (high confidence). (Summary for Policymakers, p.13)
The “appropriately governed” is a mysterious expression that doesn’t specify what is appropriate. A closer look at the technical summary gives better clues :
System-wide effects endanger energy and GHG emission savings. Rising demand can diminish energy savings, and also produce run-away effects associated with additional consumption and GHG emissions if left unregulated. Savings are varied in smart and shared mobility systems, as ride hailing increases GHG emissions due to deadheading, whereas shared pooled mobility and shared cycling reduce GHG emissions, as occupancy levels and/or weight per person kilometre transported improve. Systemic effects have wider boundaries of analysis and are more difficult to quantify and investigate but are nonetheless very relevant. Systemic effects tend to have negative impacts, but policies and adequate infrastructures and choice architectures can help manage and contain these. (Technical Summary, p.133)
In other words, digitalization can be an enabler for ecological transition if governments constraint overall consumption and induced demand created by digitalization. Furthermore, it implies a powerful state that could go against its digital industry while funding heavily less profitable sectors (infrastructures, etc.). One could wonder if the rise of tech giants and digital companies does not strongly inhibit the emergence of such a state. So far, IPCC’s conclusions could be considered as unrealistic, yet part of the tech sector has been build on heavy state funding and protected markets so their entanglement is more concrete than the sector likes to admit. From an environmental crisis perspective, we are left with no clear idea of what to expect from digitalization.
Visions of the futures: an ecological and digitalized transition?
Important
Can you guess where this video was filmed?
Scholars in STS (Science & Technology Studies) talk of sociotechnical imaginaries to describe visions of desirable futures held by advances in science and technology. In the case of digital technologies, Mager & Katzenbach reminds us that these imaginaries are:
- multiple – […] tracking the trajectories of multiple imaginaries and their relation to one another
- contested – […] involves the investigation of more or less explicit contestations and struggles over dominance
- commodified – […] is often not motivated and propagated by state actors and their interests, but by commercial actors’ assumptions about technology that directly shape the design of their products
the definition of sociotechnical imaginaries (SIs) encompasses “collectively held, institutionally stabilized, and publicly performed visions of desirable futures, animated by shared understandings of forms of social life and social order attainable through, and supportive of, advances in science and technology” (Jasanoff, 2015 in Mager & Katzenbach, 2021)
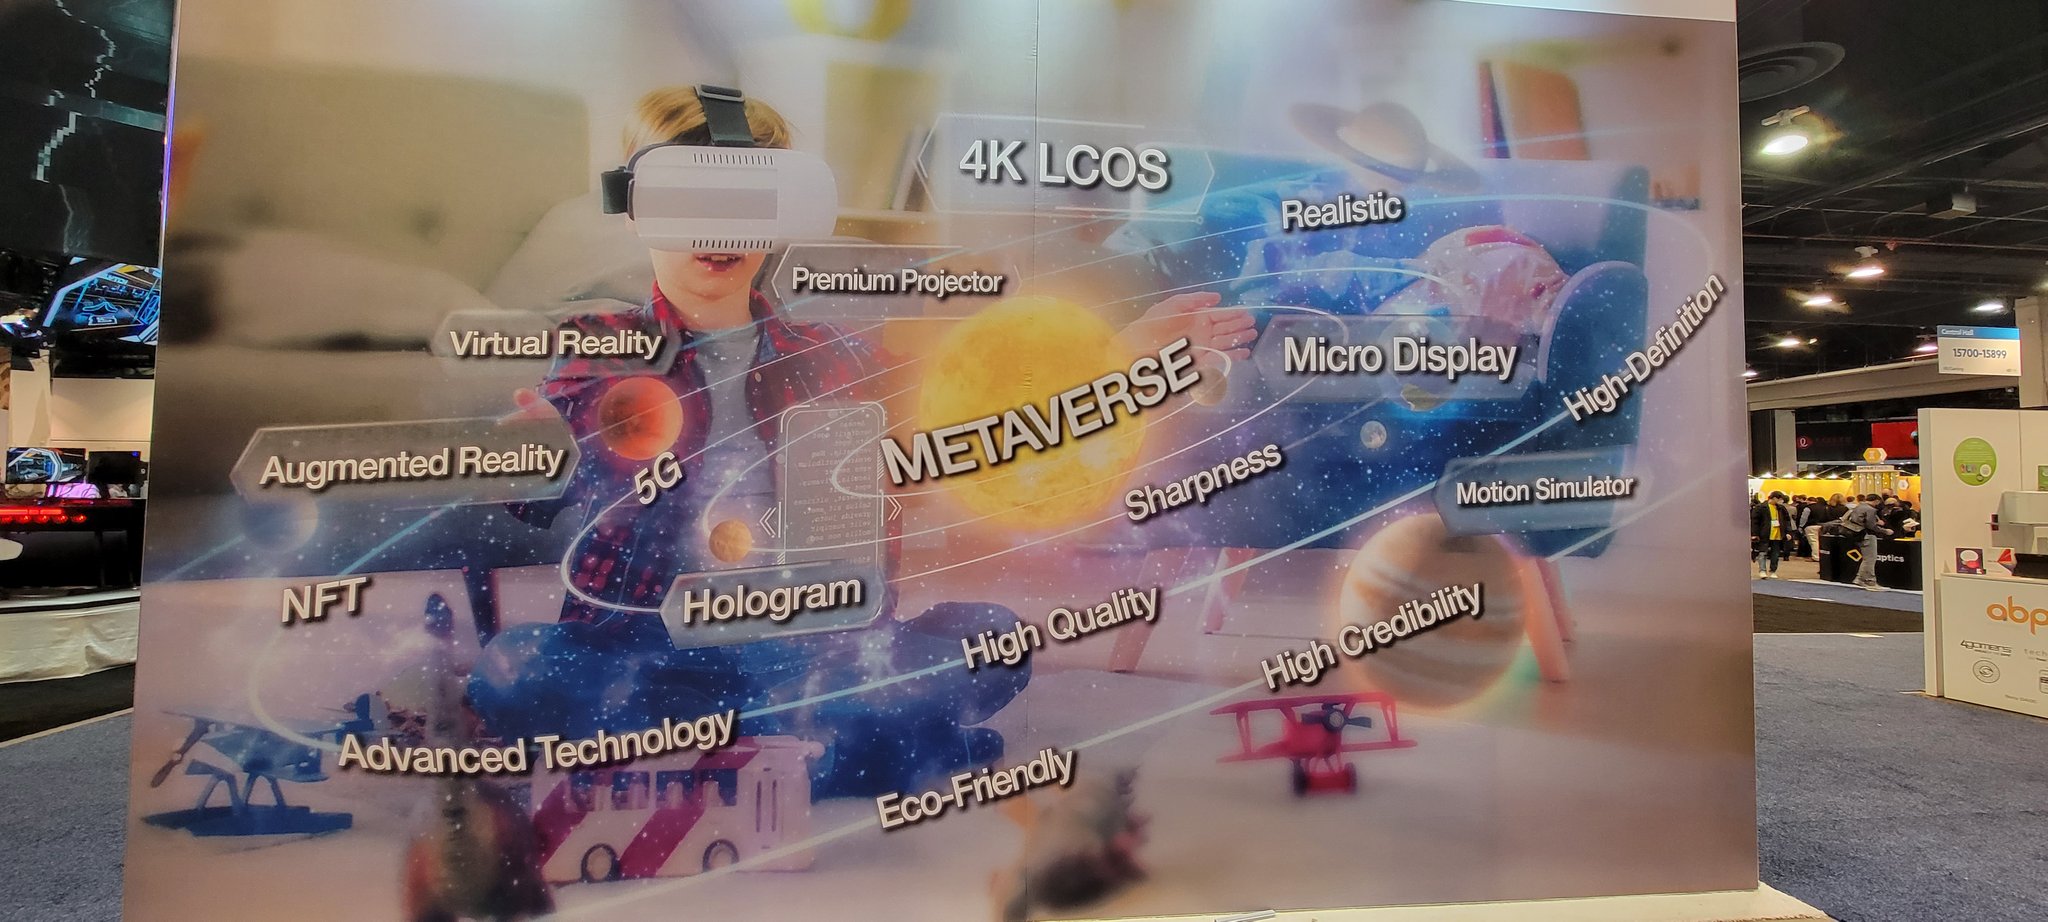
We are constantly exposed to new claims that technology X will revolutionized the sector Y in N years. This is not surprising as digital technologies can be a very capital-intensive sector, it means that companies need to keep attracting new investors, growing their customer pool and retain them. To maintain this cycle, the sector produces new claims, reports, pictures, videos, sponsored press coverage at a fast pace. Potentially, building these imaginaires enables to control what we expect from the future, and to make a specific solution inevitable.
[…] corporate future imaginaries travel, translate into and gain ground in local contexts, social practices, and even people’s mind. Annette Markham pinpoints this pervasive influence with the notion of “inevitability.” This indicates that technology companies not only take over the imaginative power of shaping future society from state actors, but partly also their ability to govern these very futures with their rhetoric, technologies, and business models. (Mager & Katzenbach, 2021)

Corporate imaginaries are not meant to be true, they are meant to secure investment and cash flow, and maintain visions of the future where these investments are still relevant, in order to keep investors’ trust. This is completely understandable for a company. However, they also greatly reduce the “imaginative power of shaping society”, which was previously held by the state, and prevents alternative imaginaries to foster. This only left us with the hope that corporations’ imaginaries and development plans are truly aimed to be sustainable, because that could be the only imaginaries left.
[…] these influential corporations steer the making and governing of digital technology both with their products and with their prophecies. (Mager & Katzenbach, 2021)
Important
Related case study : Amazon Go
Important
Related activity : Technological failures
Most of these imaginaries are presented under optimal conditions (good weather, good traffic, etc.) and need controled environments to work seamlessly. Yet, the most interesting part of every technology is when it is used in real life conditions, sometimes leading to cocktail effects. In the picture below, you can see delivery robots from a food delivery service blocked by free-floating scooters in an U.S. campus.

Tech companies don’t emphasize primarly on sustainable imaginaries. It is generally assumed that digitalizing is a sustainable process by nature. Therefore, increasing digitalization would only make our world make sustainable. However, recent years showed an increasing concern about this framing, some even estimating that digitalization makes things worse. Before diving into the environmental footprint of digitalization, it seems necessary to understand the assumption that digitalization would be sustainable.
The environmental history of digitalization
Technologies become infrastructure only after they are perfected to the point of being routine. We notice them only when they fail. (Nathan Ensmenger, p.14)
Questioning the future of digitalization invites us to reflect on its environmental history. The digital sector and its development have been largely accompanied by discourses of dematerialization or abstraction from the “material world.” The historian Nathan Ensmenger summarizes in part the genealogy of ideas that, from Nicholas Negroponte to Diane Coyle, weave the image of a world in which “material resources would be largely useless” , where “the material (atoms) would be replaced by the virtual (bits)” , or present the image of a “weightless” economy.” A founding ideological act of the sector, the declaration of independence of Cyberspace proclaimed in 1996 in Davos, is indicative of these ideas.
Your legal concepts of property, expression, identity, movement, and context do not apply to us. They are all based on matter, and there is no matter here […] (A Declaration of the Independence of Cyberspace)
Digitized systems and services have their own materiality made of mines, foundries, factories, cargo ships, cables, data centers, antennas, landfills, processing centers, … Adding this material layer can even lead paradoxically to a second materialization if physical and digital services are superimposed for the same service. Several recent studies question the prospect of dematerialization linked to digitalization. In a 2016 research article examining material consumption trends over the past few decades, Magee and Devezas conclude, “…the extension of [dematerialization] theory and empirical examination indicate that dematerialization does not occur, even for cases of information technology with rapid technical progress. Thus, a completely passive policy that relies on unfettered technological change is not supported by our results.” Despite this, the theory of the immateriality of digital technologies is still widely present in the collective imagination, for example with a term like cloud (hosting on a remote “virtualized” server) and by the perpetuation of the camouflage and discretion of infrastructures.
If we focus solely on the consumption side of computing and information technology, this model of a radical, discontinuous break with our industrial history does seem plausible. For the most part, we experience only the positive benefits of information technology, in large part because the labor and geography associated with the construction, maintenance, and dismantling our digital devices has been rendered largely invisible. (Nathan Ensmenger, p.10)

The idea of dematerialization calls also for an “anti-geographic” thesis (Marquet, 2019), that is, the idea of an “abolition of space and the dissolution of cities by digital technologies.” This thesis would have been supported by a number of influential people such as Marshall McLuhan, Alvin Toffler, Paul Virilio, Nicolas Negroponte, Bill Gates or Manuel Castells . In line with this idea, Frances Cairncross proposes “the death of distance” to undermine “the importance of geographic concentrations in cities” in a world where information and communication technologies (ICTs) are revolutionizing social and professional relationships. This perspective of a dissolution of space could be described as a movement of deterritorialization together with that of dematerialization: without materiality to describe and to place in the thickness of space, there is possibly no more territory to describe. The “anti-geographic” or deterritorialization thesis could lead us to think of the digital infrastructure and its services as a sheet that is laid down and covers the entire globe in a homogeneous manner, indifferent to any local roughness or context.
The Information infrastructure of the twenty-first century is built around the bones of the nineteenth-century transportation and communication networks. These were in turn constructed along riverbeds and mountain passes. Geography shapes technology, and vice versa. (Nathan Ensmenger, p.19)
Understanding the digital sector and its systems is a complex exercise, given that they exist simultaneously in two states: concentrated and diluted. On the one hand, there is a significant concentration of capital, value capture, means of production, and infrastructure, and on the other hand, digitalization is diffusely transforming all sectors of activity: industry, public policy, logistics, finance, entertainment, etc. Thus, the material description of the digital sector poses two problems a priori: a conceptual problem, how to describe the material realities of a sector that has forged an immaterial imaginary; and a problem of perimeter, in a sector that is not equally distributed but that touches most of the activities on Earth, where does the description end? Similarly, if we admit that the ideas of dematerialization and deterritorialization have developed together, how can we stitch material and territorial realities together? This requires us to define what the materiality and territoriality of the digital sector are and to trace them methodically before we can even integrate the issues of the environmental crisis.
Automobiles pollute, nuclear energy produces toxic waste, industrial agriculture is giving us all cancer—but computers keep getting faster, smaller, better. By making the physical world increasingly irrelevant, information technologies allow us to avoid confronting the consequences of our actions on the environment. (Nathan Ensmenger, p.26)
Important
Related case study : Silicon Valley 80’ : Original Sin
Futures without history
This brief exploration of digital technologies imaginaries show that first we need to reconstruct the environmental history of the digital sector as it has been shaped by a very selective bundle of ideas and theories. This bundle has tended to ignore the environmental consequences that have accompanied the emergence of modern electronics and computing, while they were taking place in front of the eyes of those who maintained the ideas of immateriality of digitalization. The power of the imaginaries we construct is such that it can allow us to ignore very real facts, from the environmental pollution of Silicon Valley to climate change. And yet, we are still building futures of digitalization that rely on these imaginaries that have denied material and environmental realities from the start. The process of reconstructing our digital imaginaries in the era of the environmental crisis will have to pass through a reconstruction of the materiality and the terriroriality of digital infrastructures. Only then will we be able to plan better for this uncertain century.

Resources
Syllabus
- Astrid Mager, Christian Katzenbach, Future imaginaries in the making and governing of digital technology: Multiple, contested, commodified, New Media & Society 23, n.2, 2021
- Nathan Ensmenger, The Environmental History of Computing, Technology and Culture 59, n.4, 2018
- Christophe Lécuyer, From Clean Rooms to Dirty Water: Labor, Semiconductor Firms, and the Struggle over Pollution and Workplace Hazards in Silicon Valley, Information & Culture: A Journal of History 52, n.3, 2017
To go further
- Sheila Jasanoff, A New Climate for Society, Theory, Culture & Society 27, n.2-3, 2010
- Christopher L. Magee et Tessaleno C. Devezas, A simple extension of dematerialization theory: Incorporation of technical progress and the rebound effect, Technological Forecasting and Social Change 117, 2017, p. 196.
- Clément Marquet, Binaire béton : Quand les infrastructures numériques aménagent la ville, Thèse de sociologie, Université Paris-Saclay, 2019, p. 21.
Session 2 : Telecom infrastructures
What are digital infrastructures?
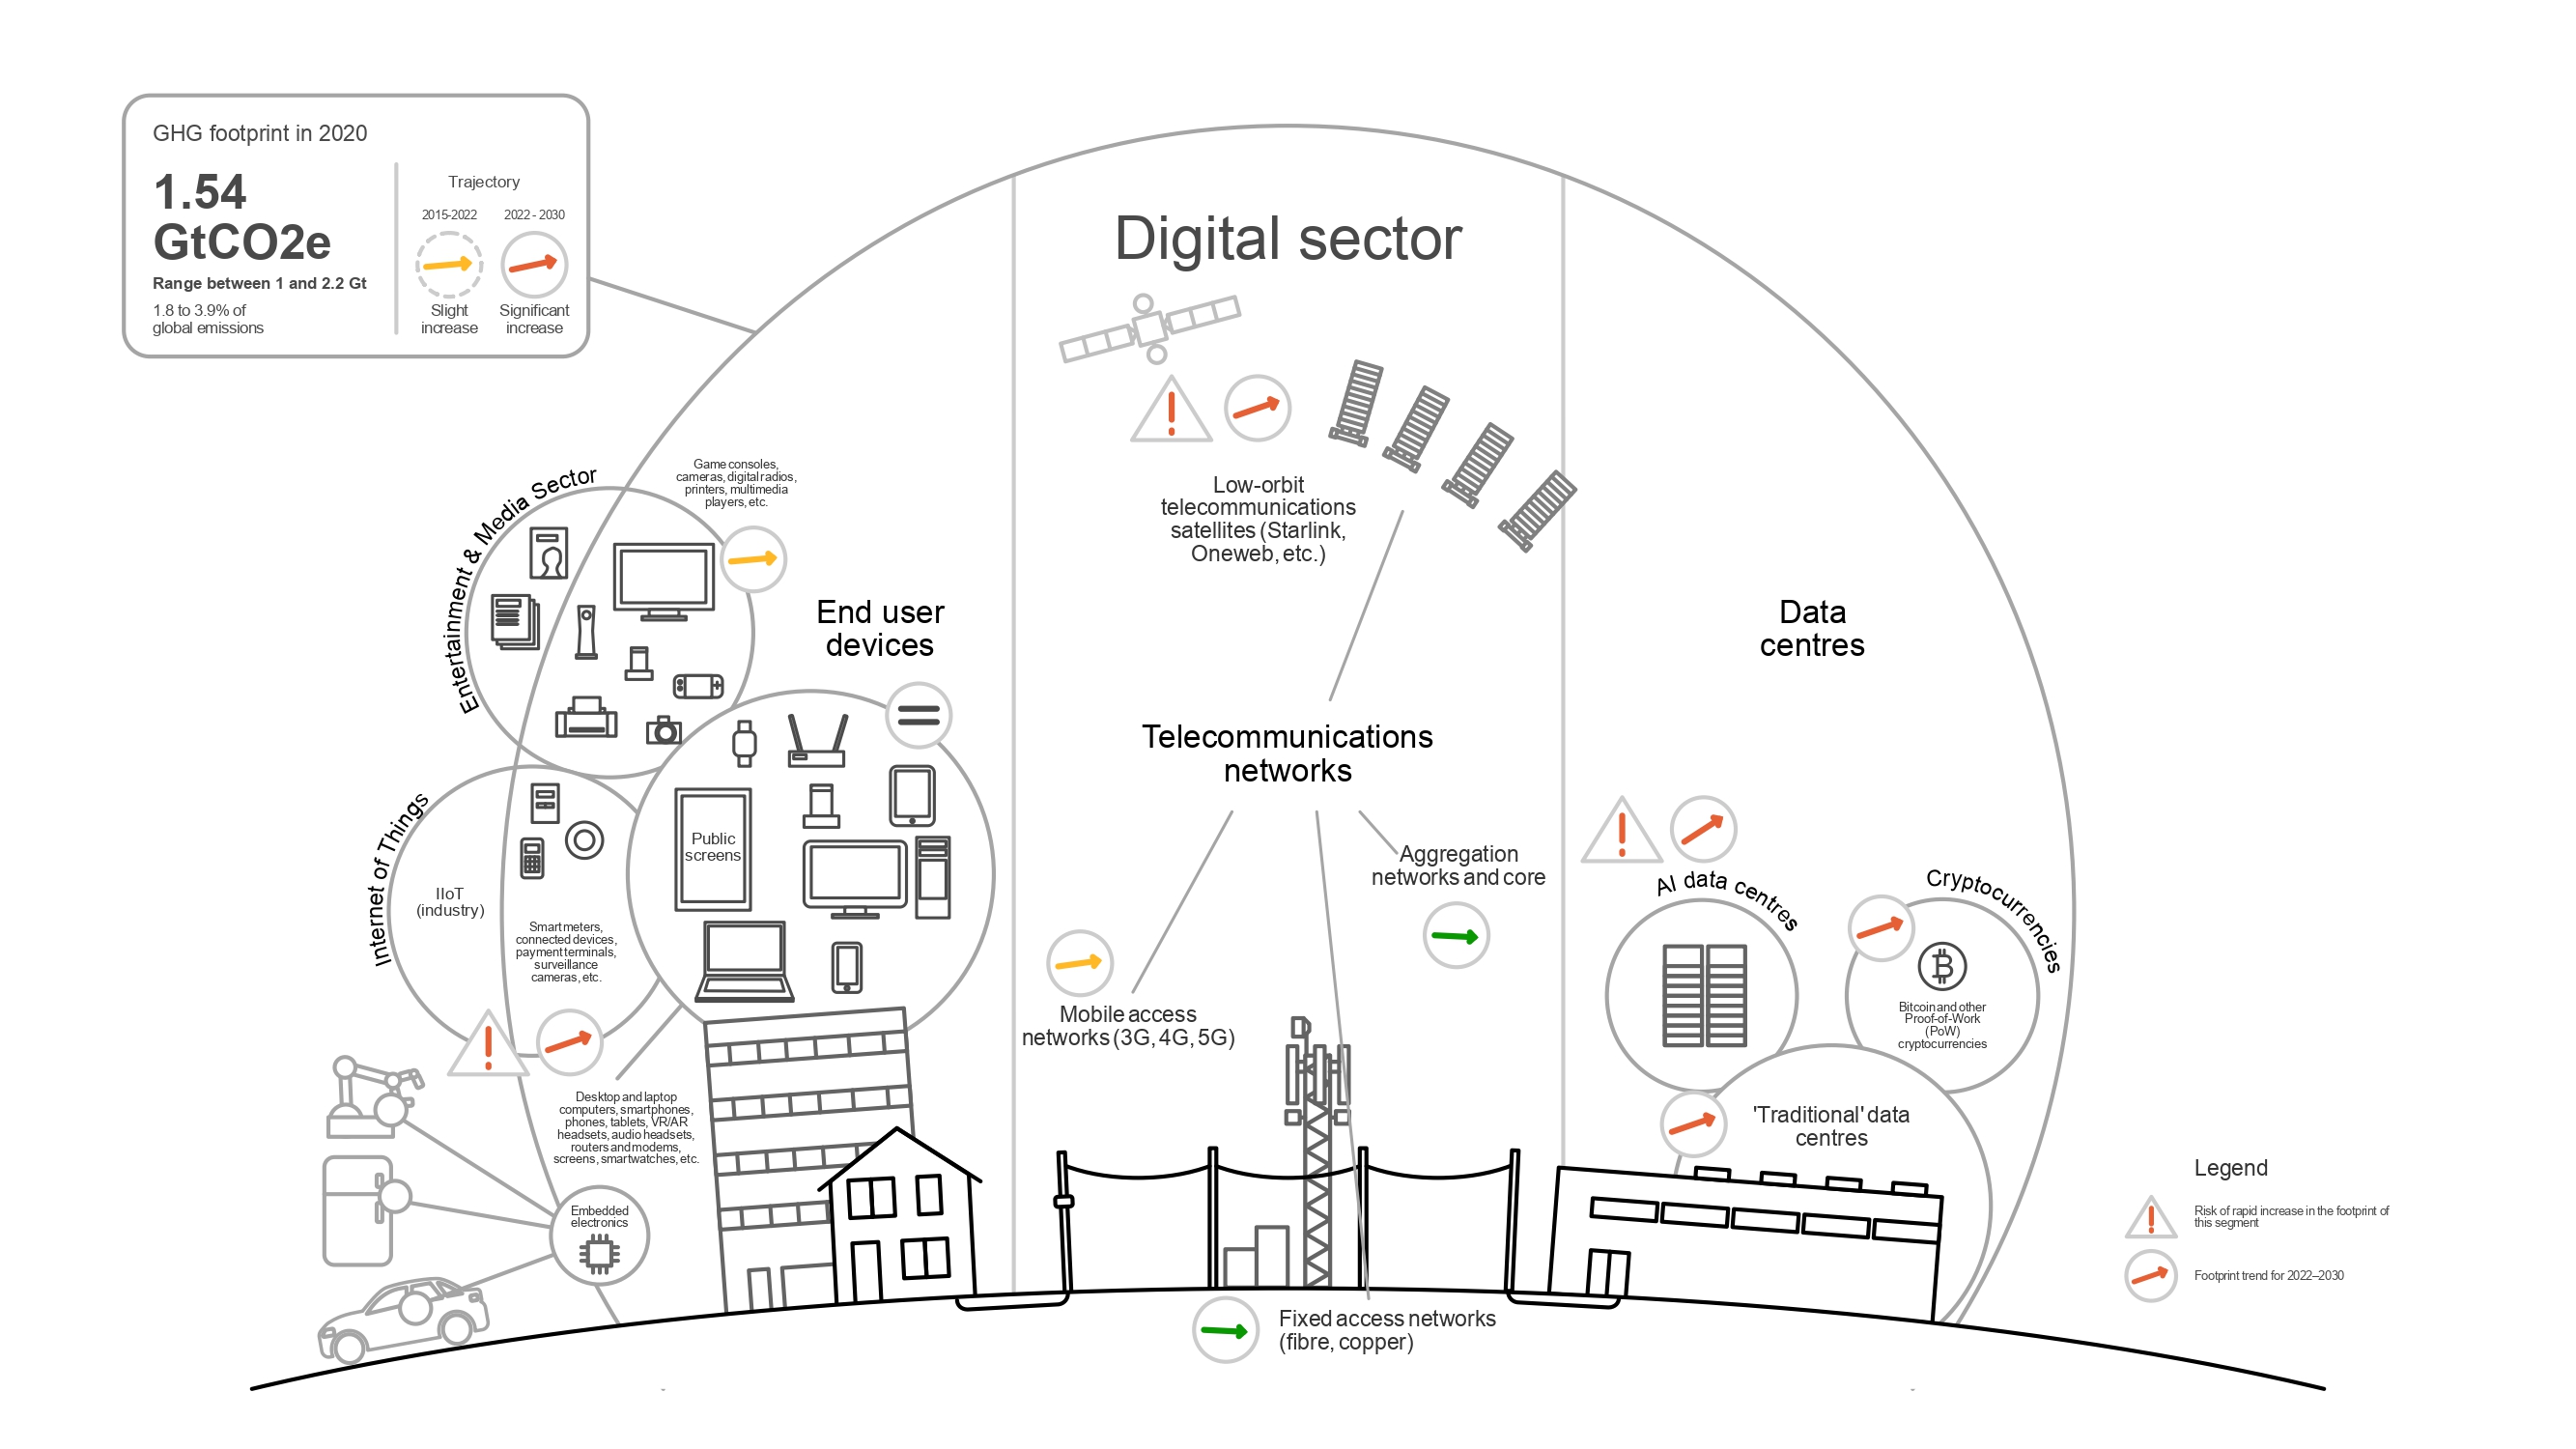
The transfer, computing and use of digital data require a series of interconnected infrastructures. Three types of systems are generally distinguished in environmental science applied to digitization: data centers, telecommunications networks, and user equipment. Understanding how these infrastructures work and their materiality is a prerequisite for environmental analysis.
Telecommunication networks
Important
Related activity : Telco treasure hunt
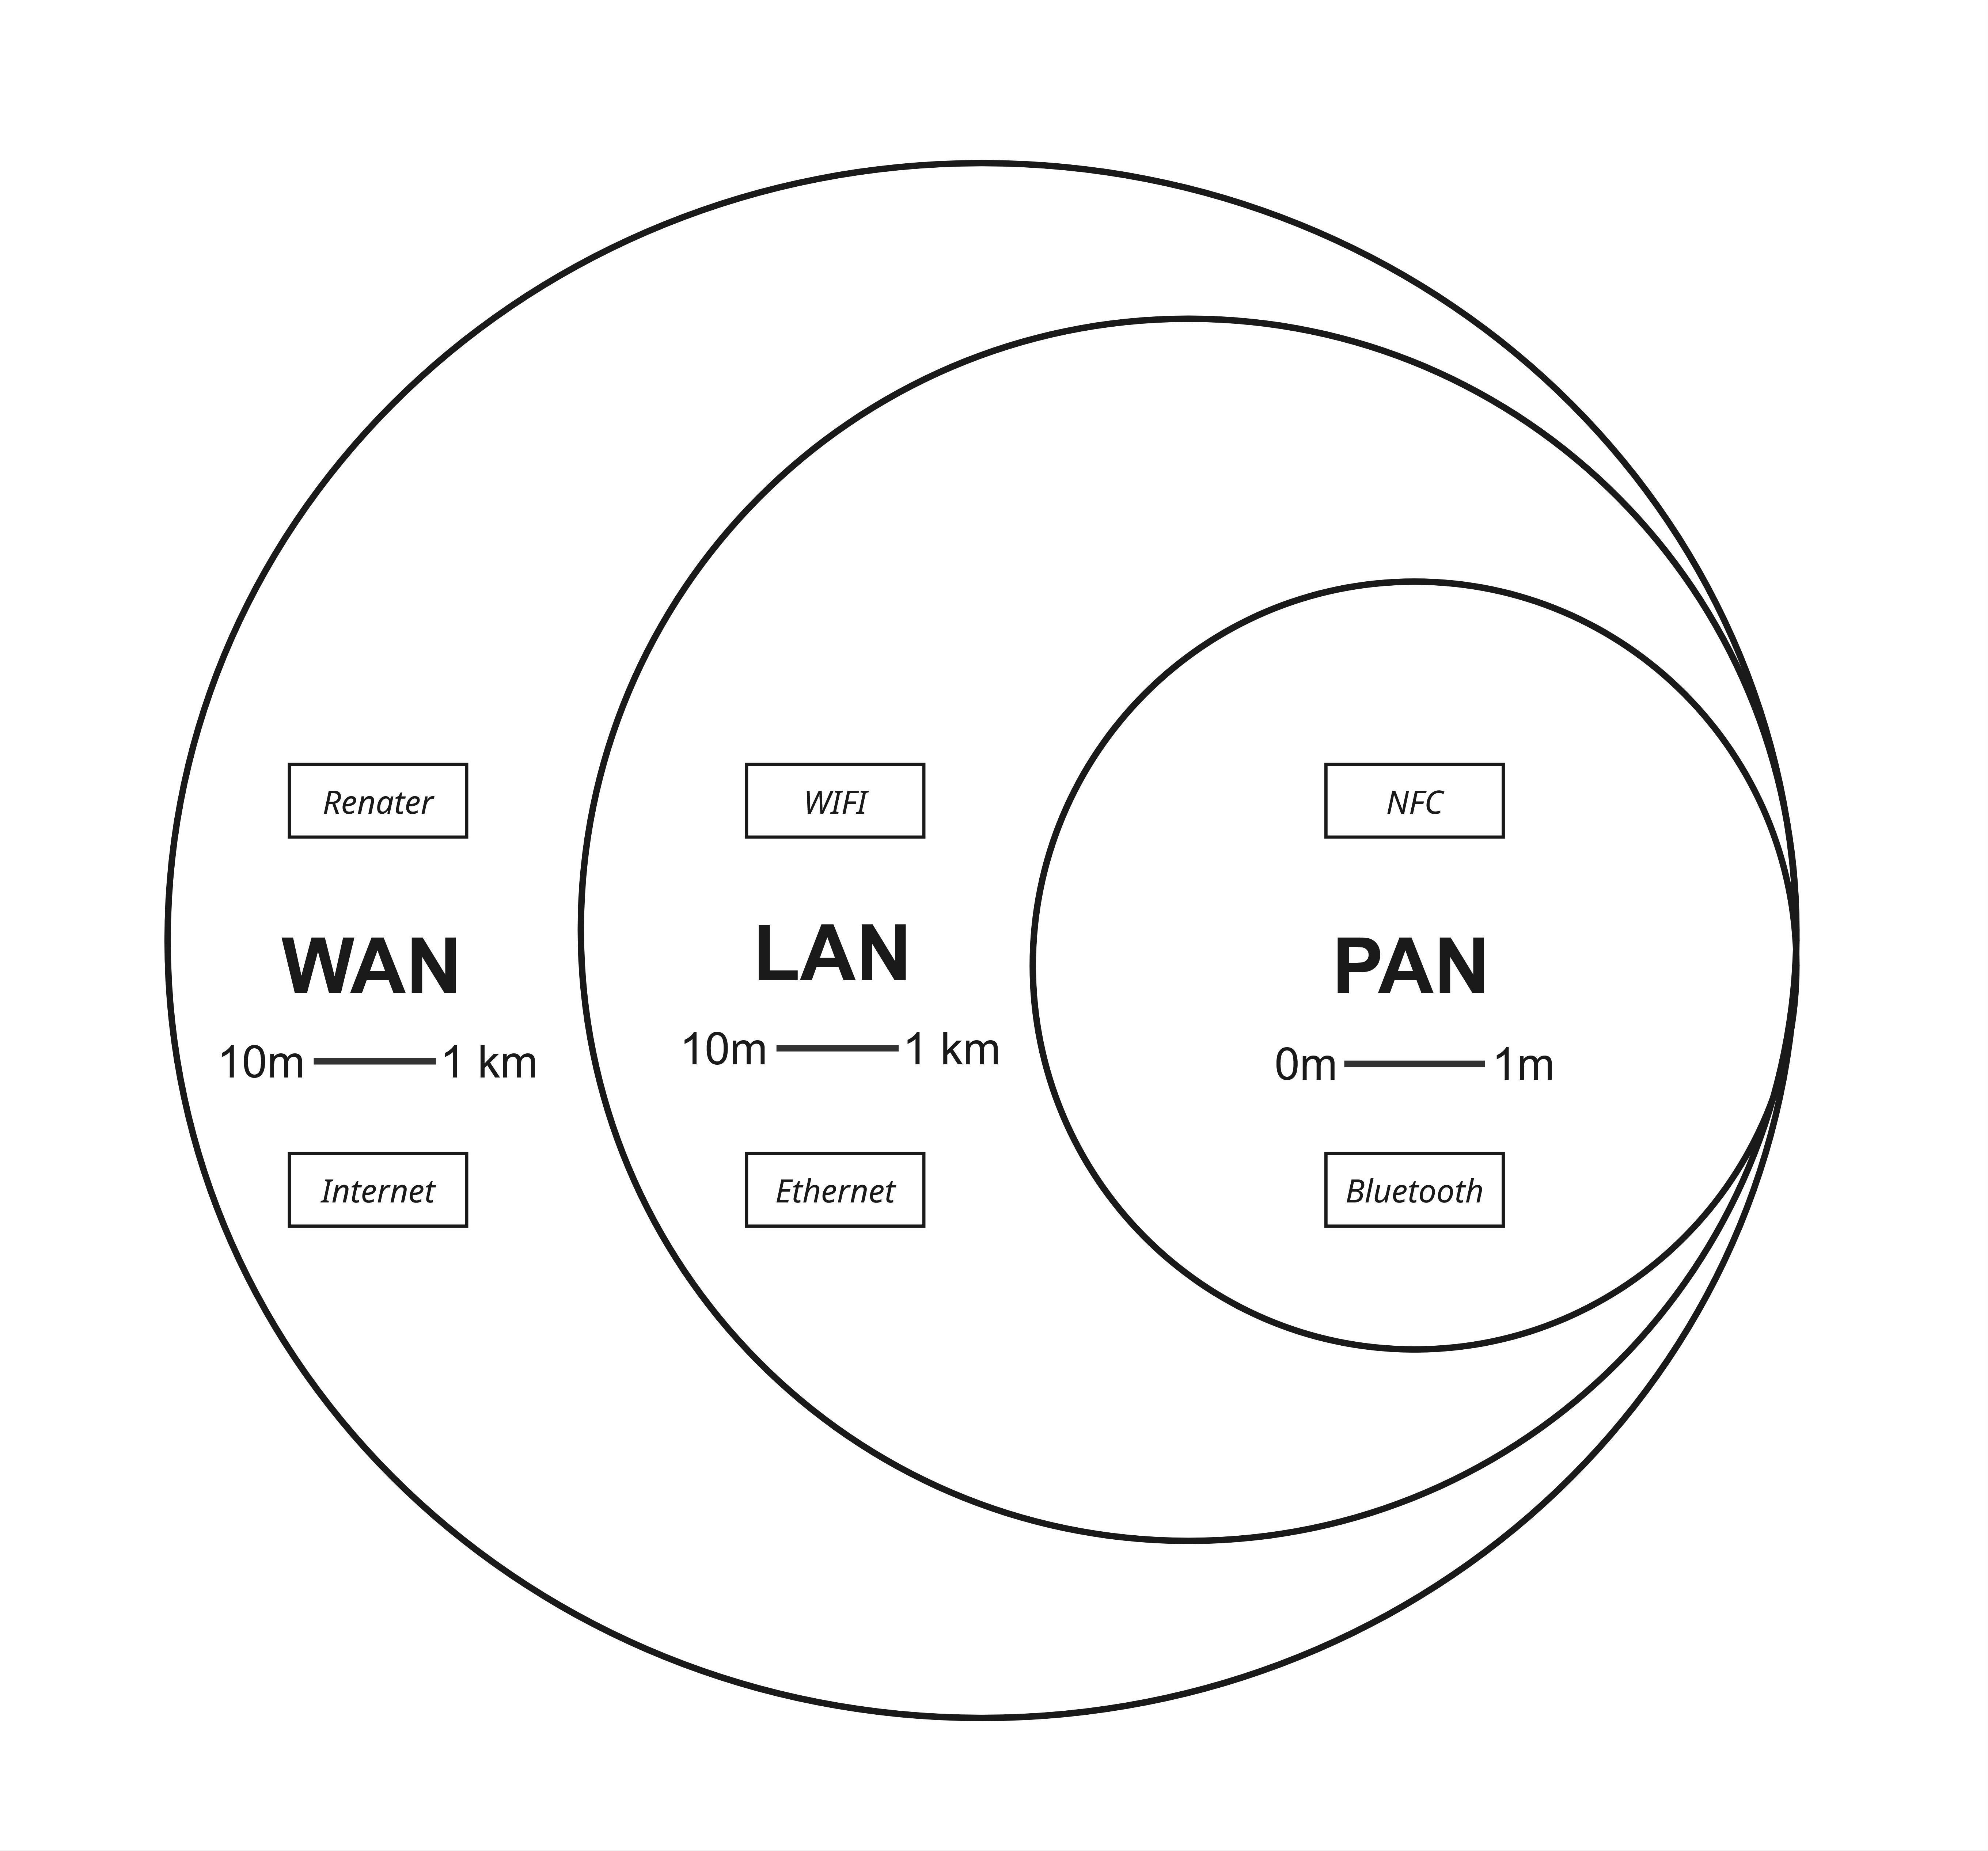
Telecommunications networks encompass a wide range of infrastructures and technologies. They are typically categorised according to the distance between the transmitter and receiver.
If we focus on internet connections, we can distinguish between fixed and radio access networks that connect fixed (computers, etc.) or mobile (smartphones, cars, etc.) digital equipment. These networks send generally data to aggregation and core networks who will route the transferred data to its destination. Each telecom operator has its own autonomous network that interconnects with private networks of companies, states, and various organizations. This interconnection between autonomous networks is ensured by what is called the “internet protocol” (IP).
Fixed access network
Fixed networks include copper networks, historically used by the telephone, and fiber networks, which are now being massively deployed in post-industrial countries. A customer connected to the fiber network has a box of his operator which is connected to the line opened by the latter. The fiber link will pass through a multitude of small equipments before arriving in the operator’s data center for processing.
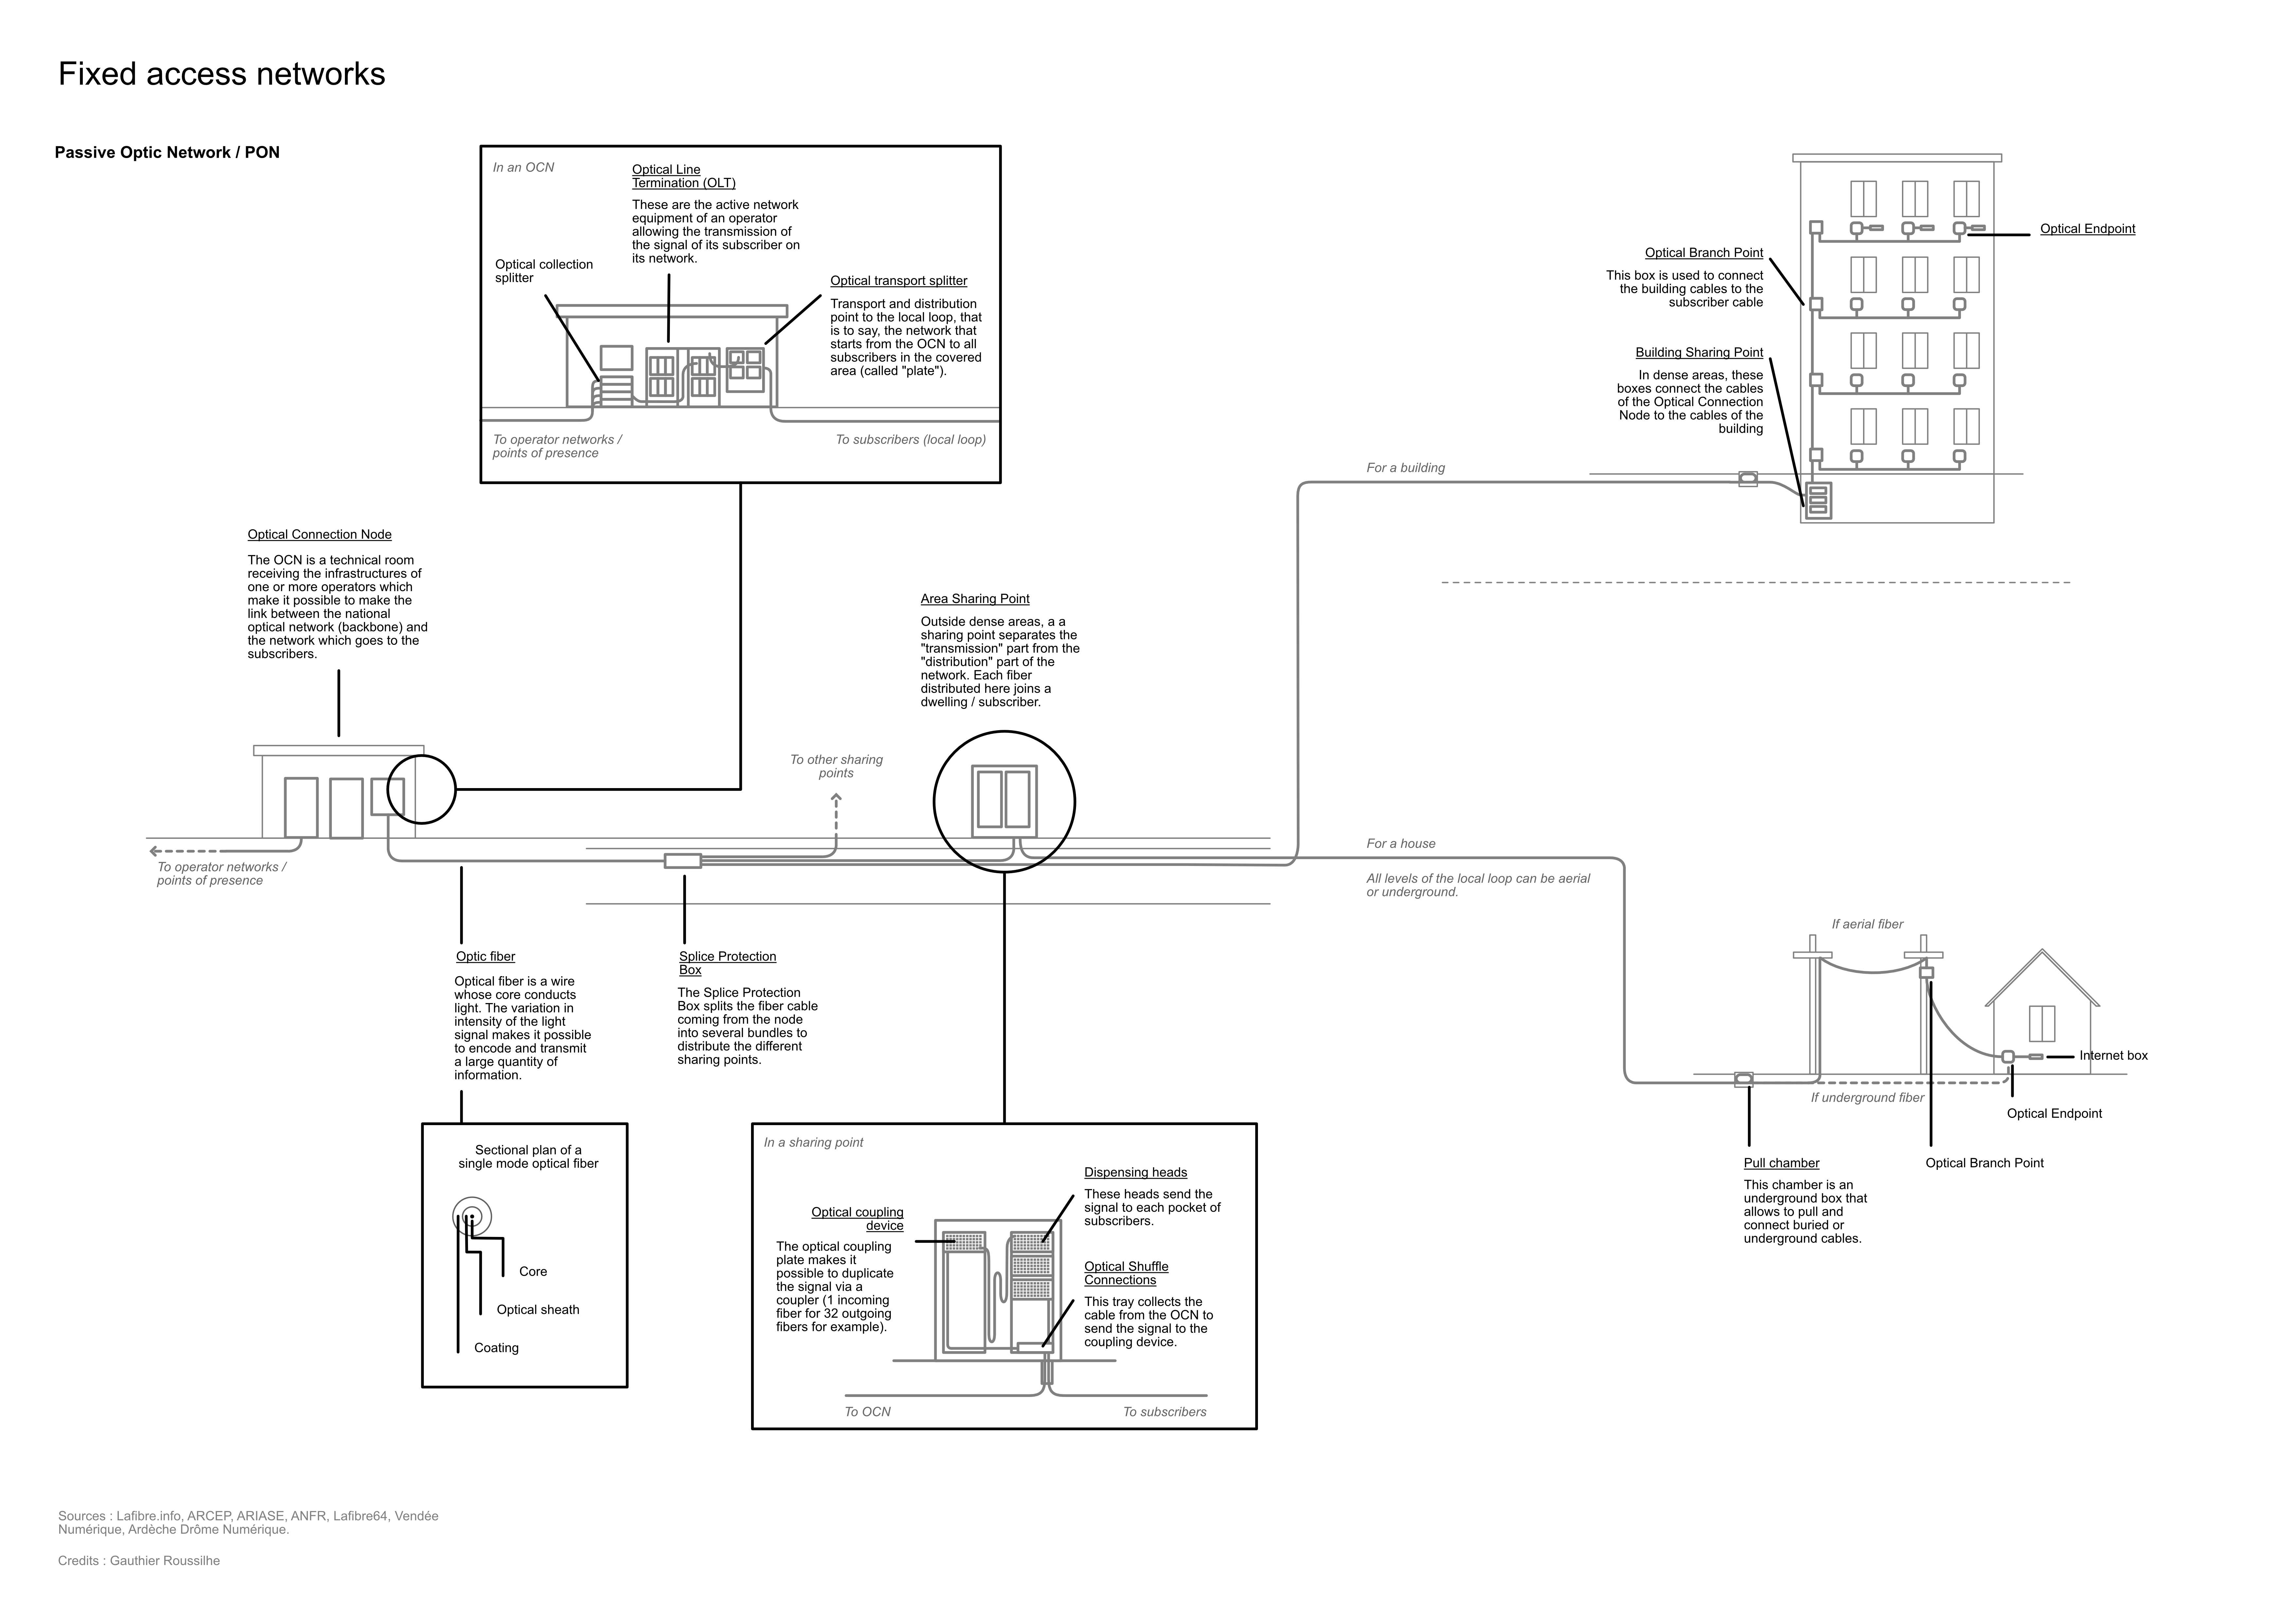
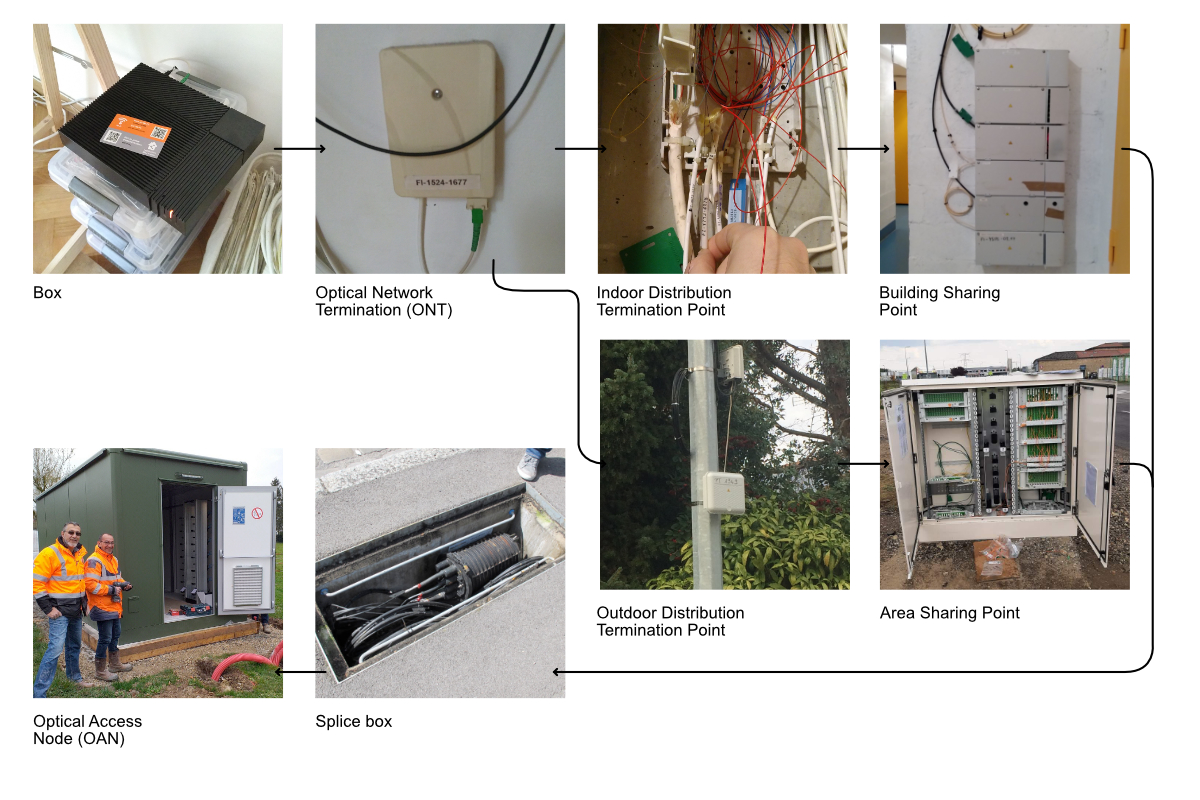
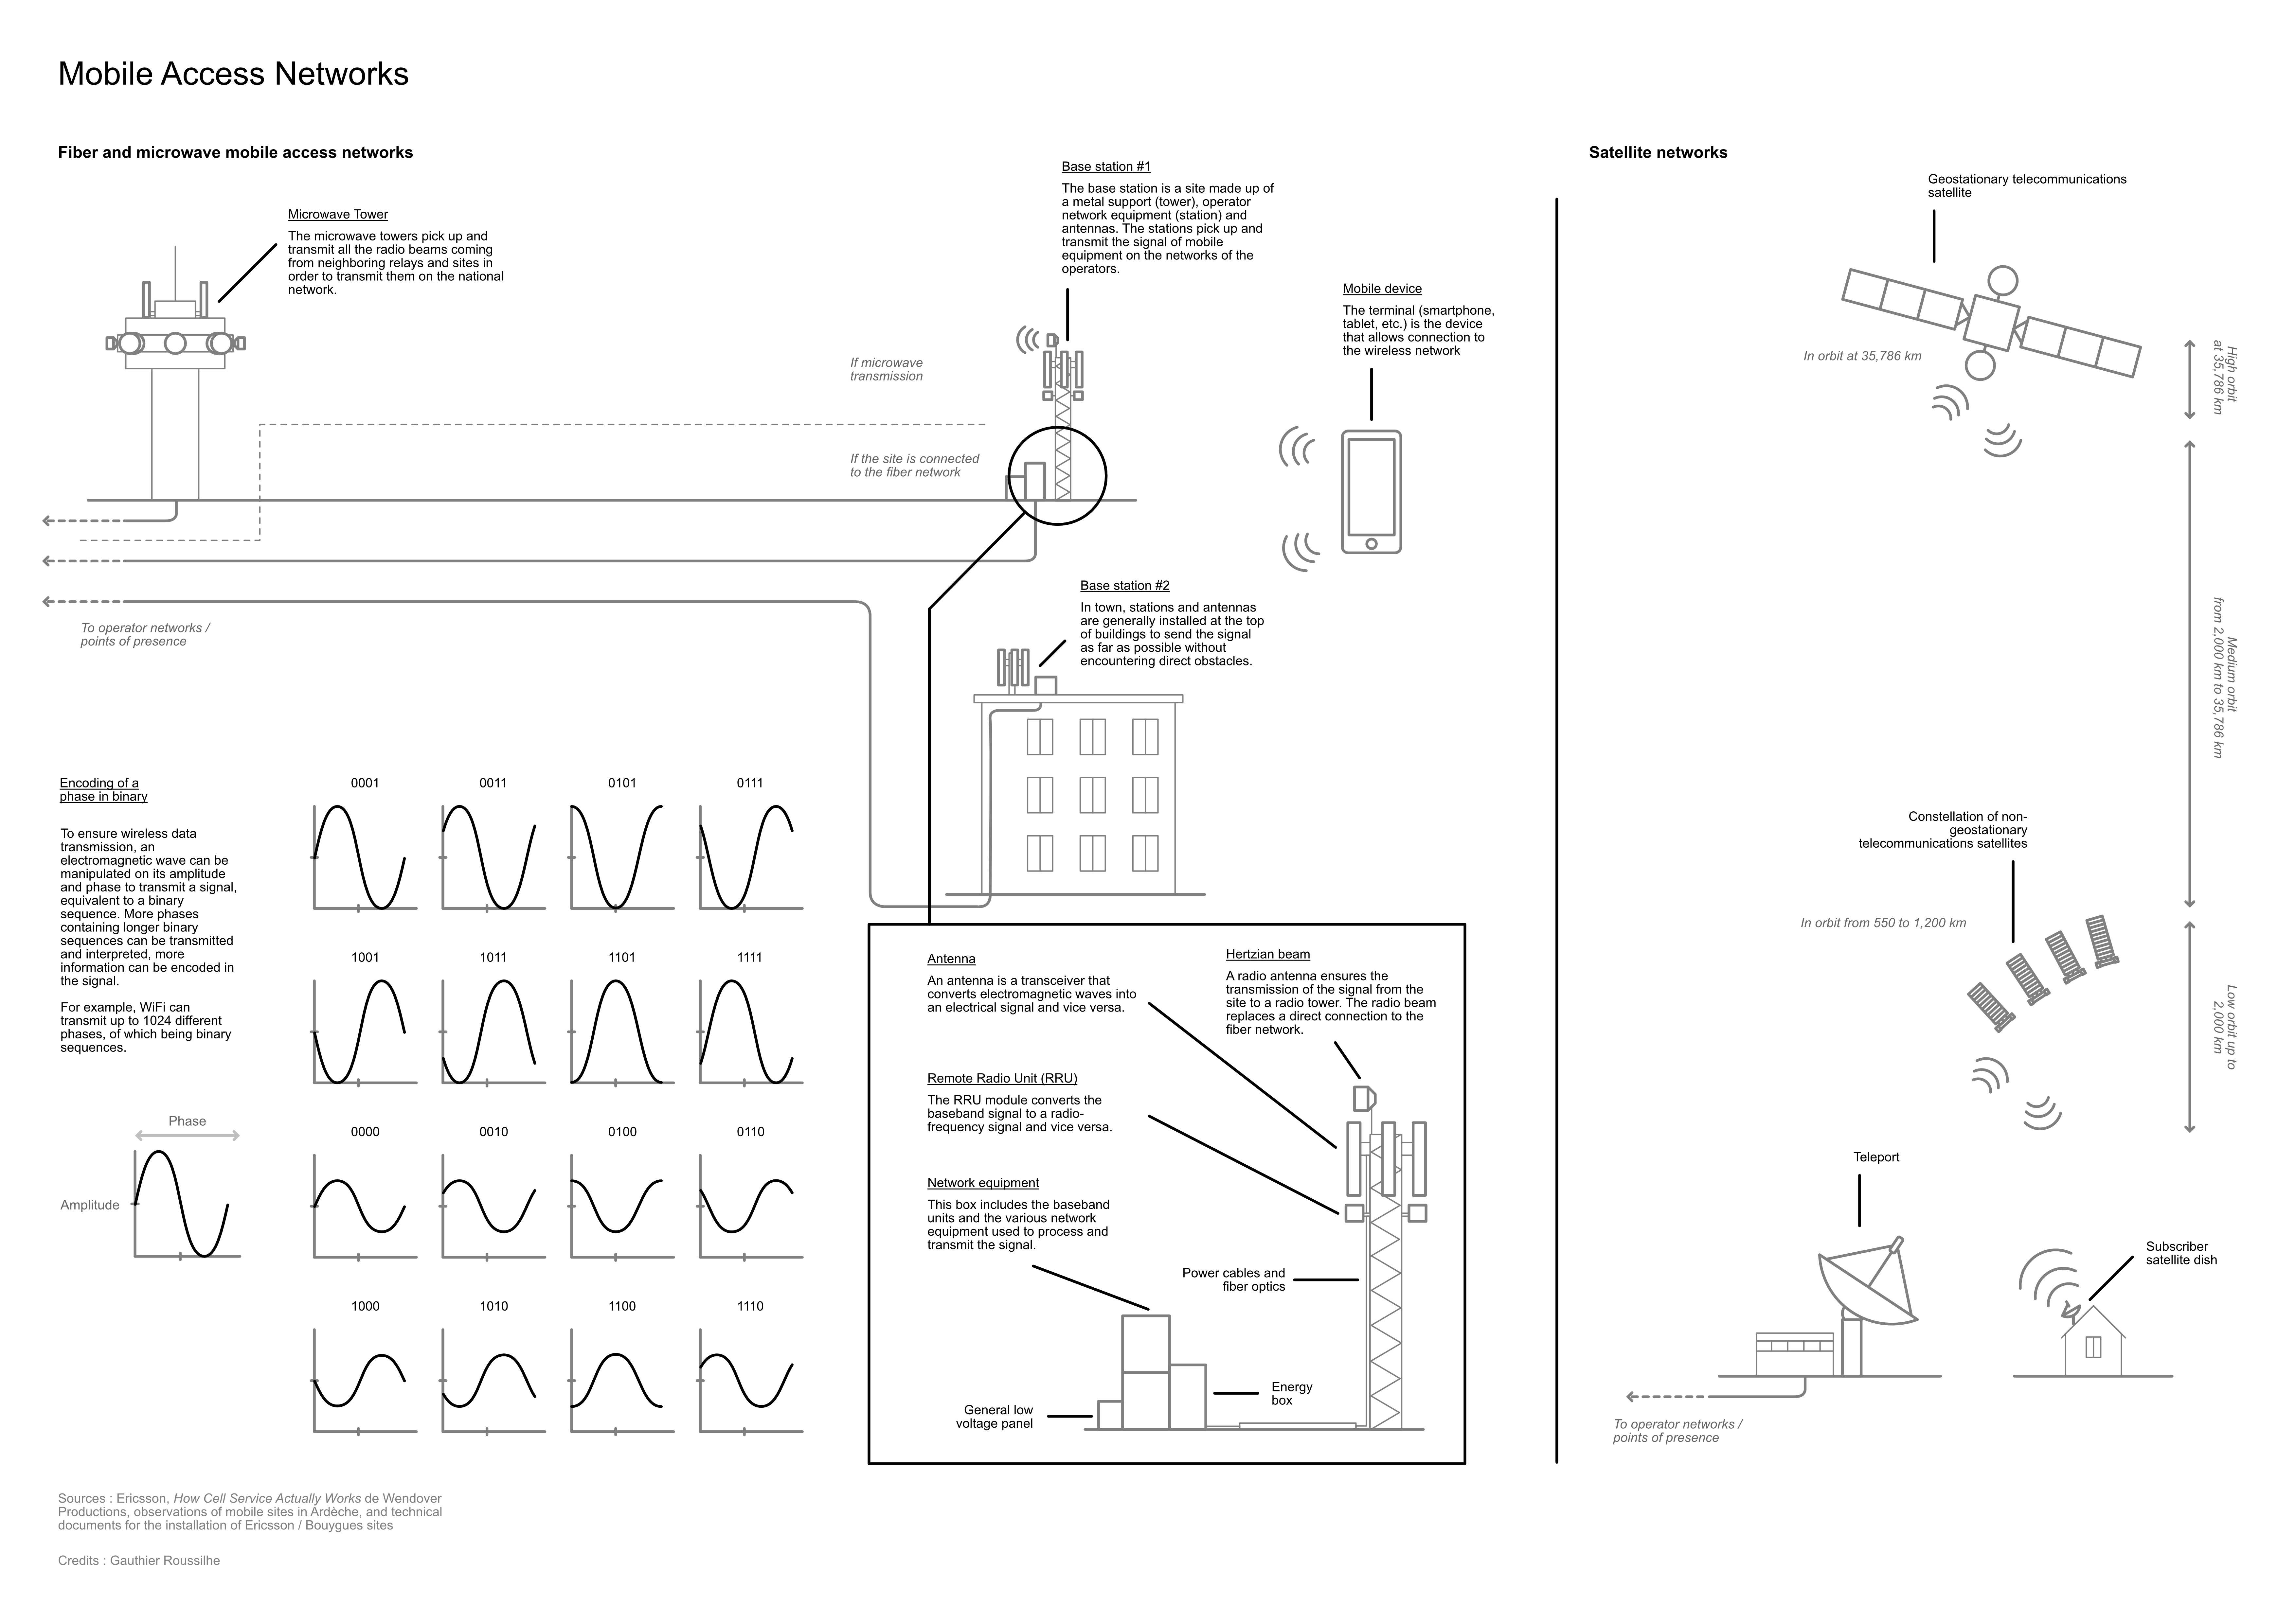
Mobile access network
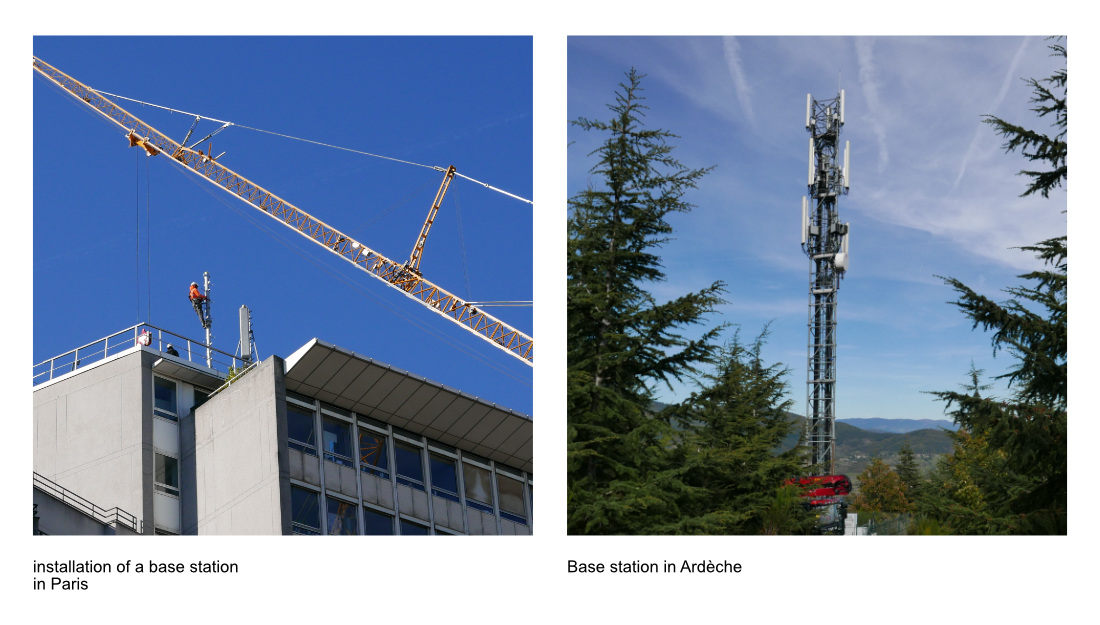
Mobile networks include 2G/3G/4G/5G stations as well as satellite solutions. A mobile device such as a smartphone maintains a permanent connection with the nearest station in order to transmit data over the operator’s network and the internet. Mobile coverage depends on the number of stations deployed on the territory. Urban areas are more easily covered and can reach many users. On the other hand, rural areas are more difficult to cover due to the low financial incentives and more complex geographies.
Aggregation and core network
Connections coming from the fixed and mobile networks then circulate on the aggregation networks until they arrive on the core network of the operator. It is usually at this point that the incoming connection is processed and rerouted to the requested destination through internet protocol. Long-haul fiber networks cover the national territory and continue into other bordering countries.
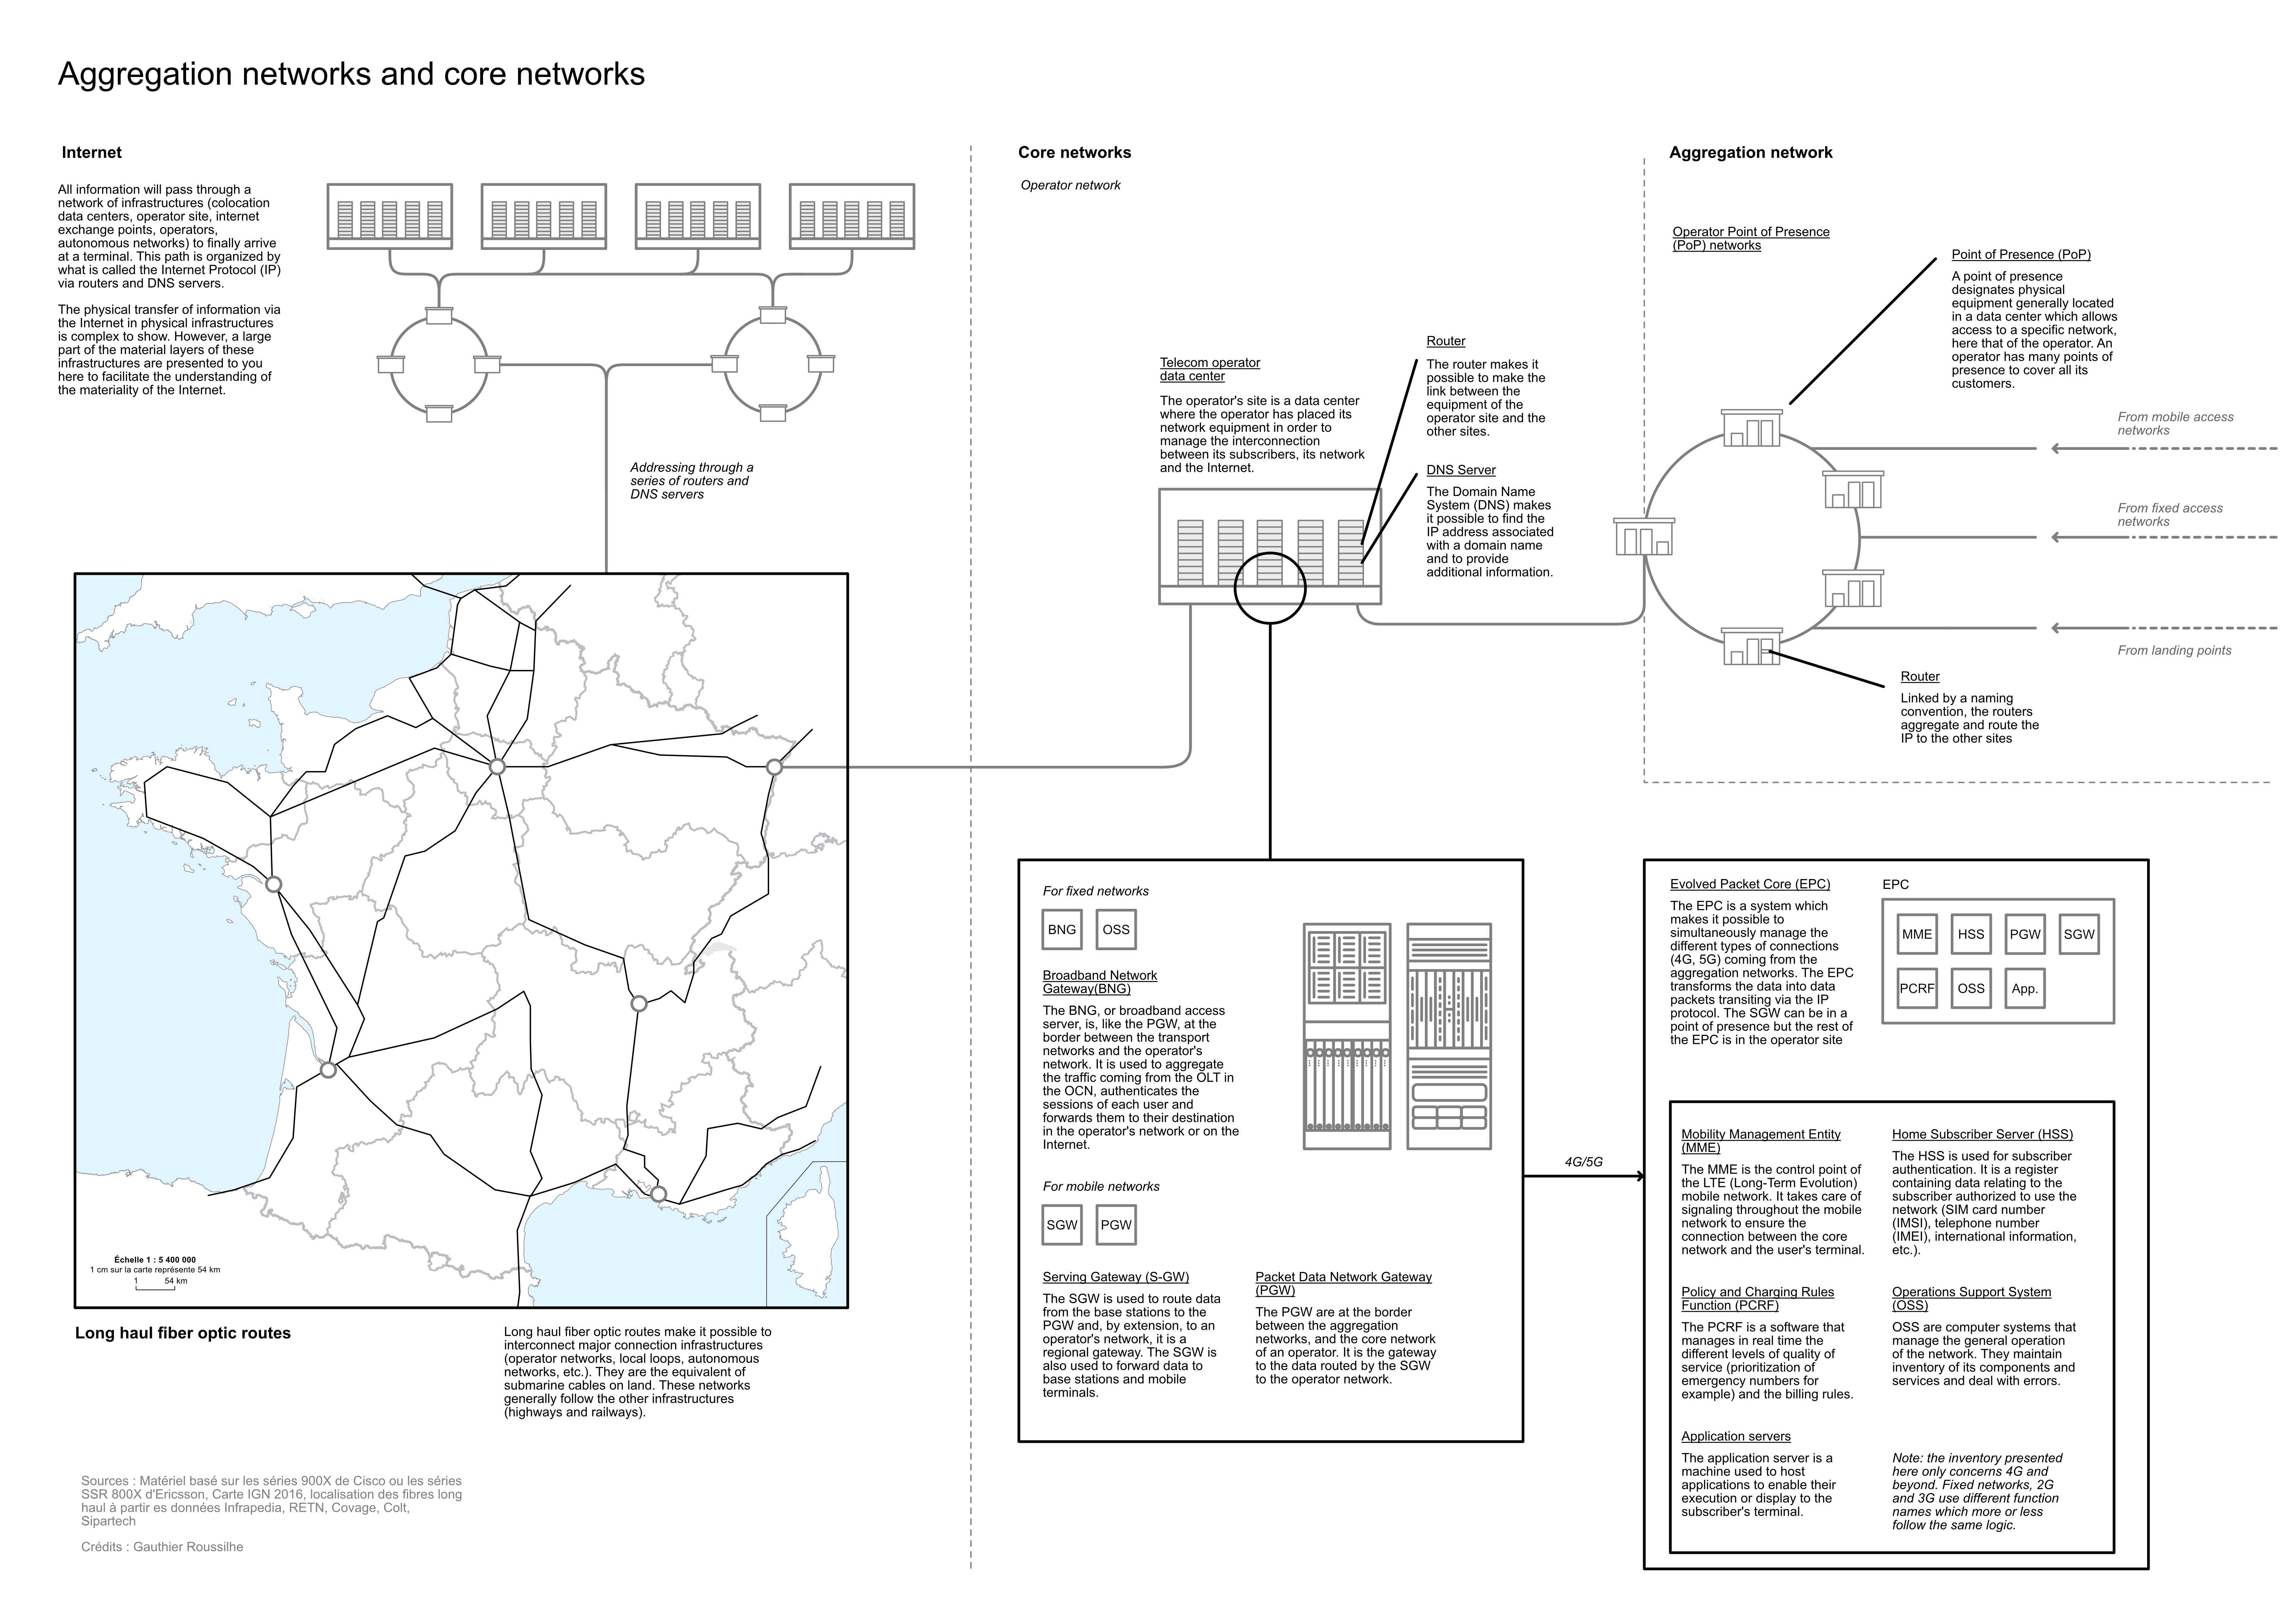
The telecommunication networks are rarely put forward yet it is a keystone of the data transfer but also the most fragile part. Most post-industrial countries are launching major projects to deploy fiber networks throughout their territory with varying degrees of success. Likewise, new generations of communication protocols are being implemented such as 5G and 6G and new services are entering the market like Starlink. The evolution of digital services as we know them is linked to the evolution of networks, which is why it is particularly important to understand what it means to deploy and maintain them.
Important
Related activity : Tracing the road to google.com
Deploying and maintaining networks in France
Deploying networks requires a great deal of civil engineering effort to integrate them into the existing infrastructure or to build new routes. It is a long job that requires many people on the ground. In many respects, the deployment of fiber in France is the largest infrastructure project on the national territory since the deployment of telephone and electricity networks.
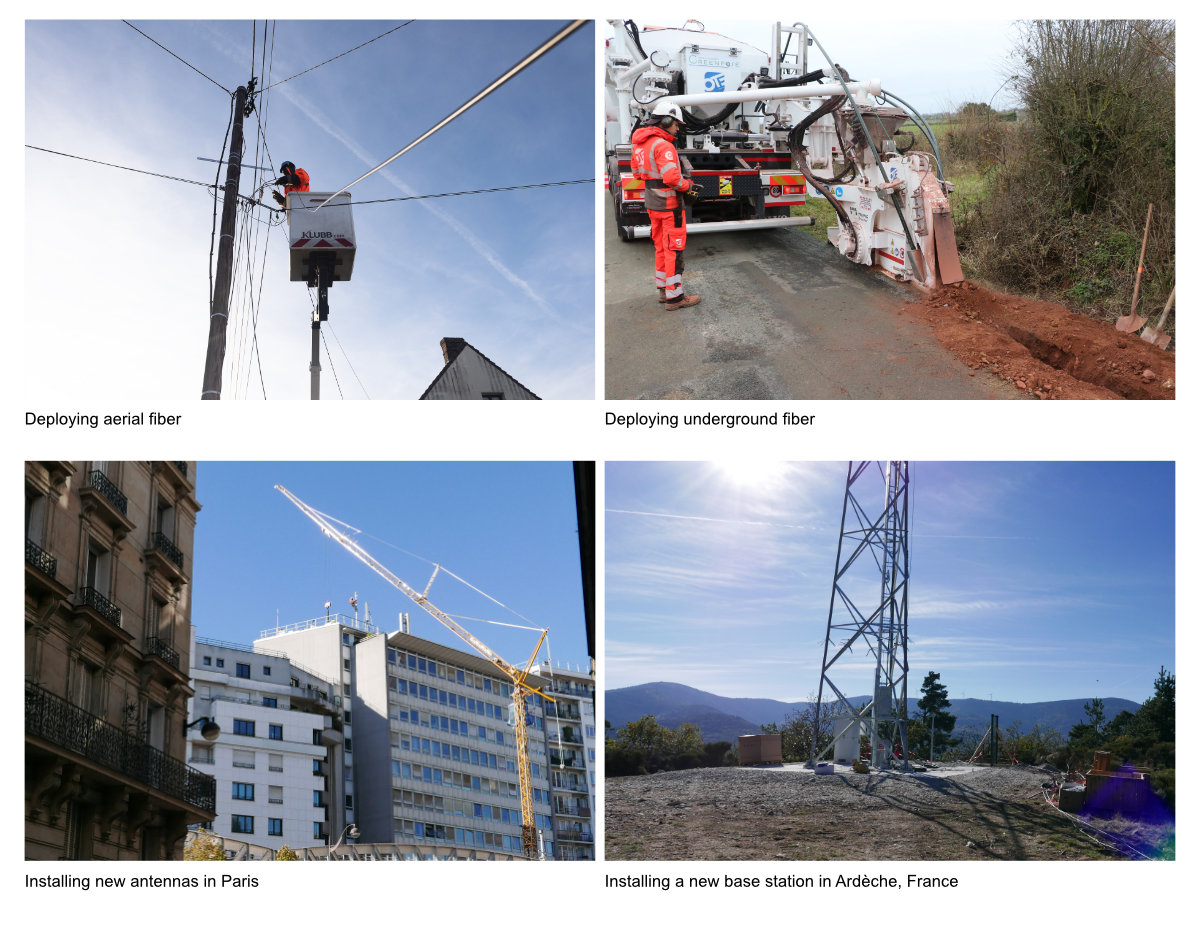
Deploying fiber with a FttH (Fiber-to-the-Home) model, which means one fiber distribution termination point (DTP) per home, is very expensive. For example, in the most expensive areas, rural areas, the deployment of fiber in Ardèche and Drôme will cost 597 million euros to install 311,000 DTP. As these areas are not profitable for private operators, it is usually the public institutions (state, region, department, etc.) that pay for the deployment and lease it to a private operator. Even with this massive deployment, 3% of homes are not connectable by fiber and are instead eligible for mobile or satellite offers. This example puts into perspective the idea that all countries on Earth could be connected directly to fiber networks. This requires enormous capital that is generally out of reach for many countries in the Global South. Access to cellular or satellite networks may then be a better option, but this affects the equality of connection access and the nature of the digital services that can be used.
Important
Related case study : Deploying fiber network in rural France
However, like any infrastructure it requires care and vigilant maintenance. Without the tens of thousands of technicians who maintain networks every day, we can assume that our Internet access would not last long. Sometimes the equipment is damaged by accident and/or because its location puts it in danger (because it depends on the constraints of other networks). In countries like France, the deployment and maintenance of fiber networks is particularly difficult because large telecom operators use many levels of subcontractors, sometimes poorly trained or with untenable objectives, with a very patchy access to information. For example, a technician may unplug a subscriber from a fiber outlet to connect his own customer.
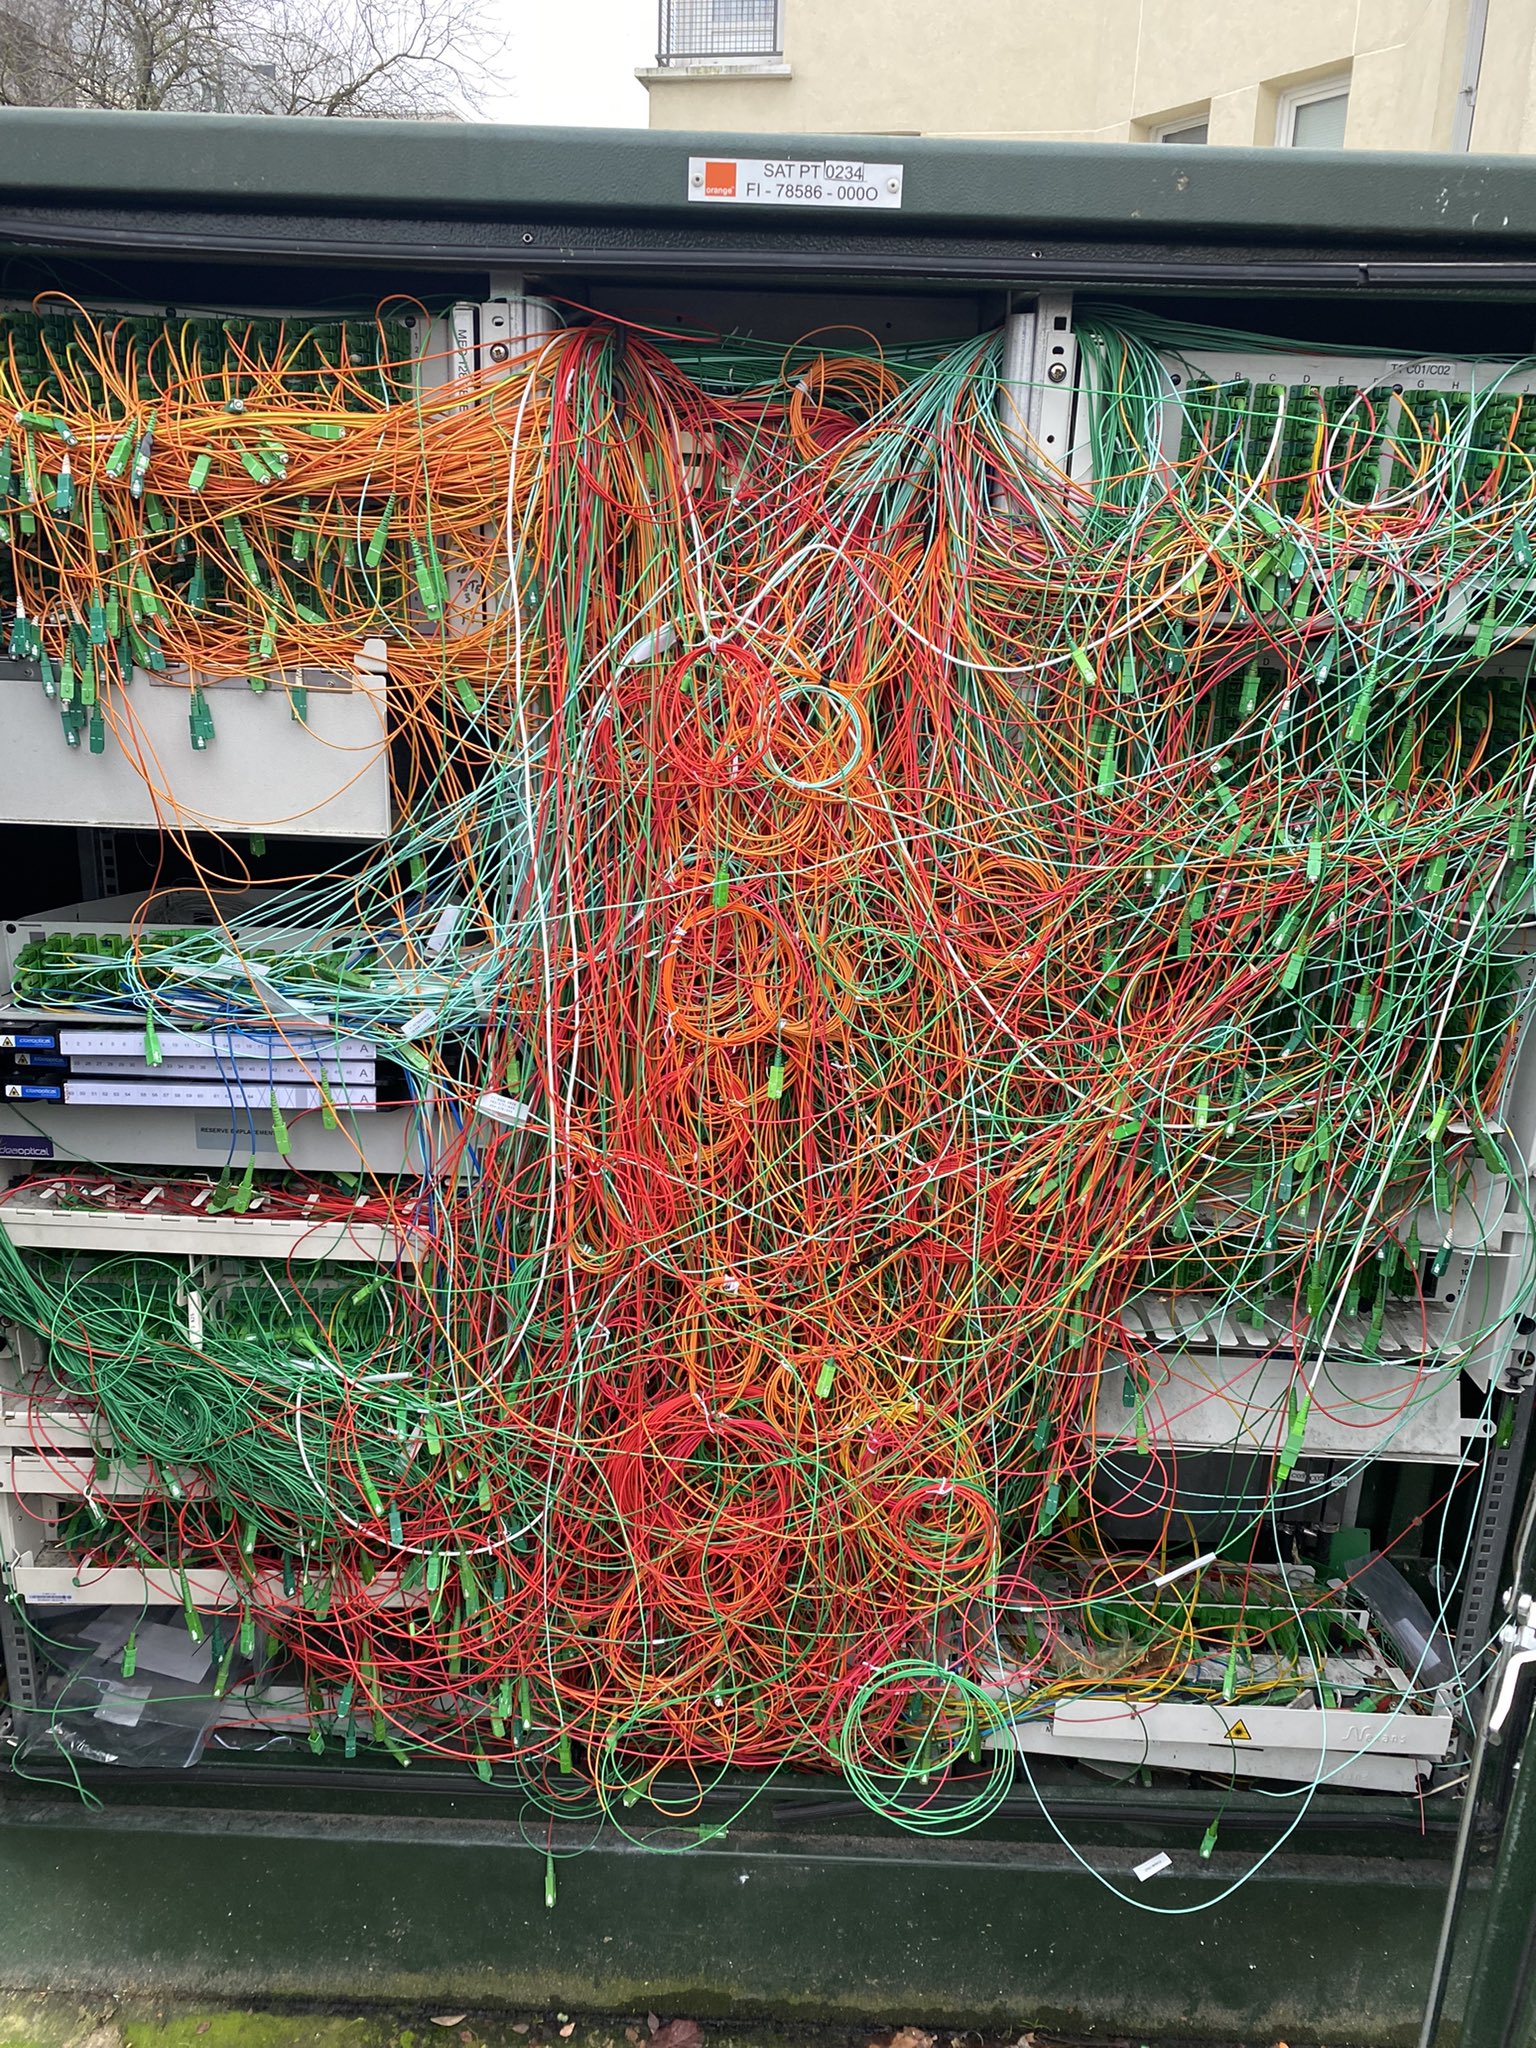
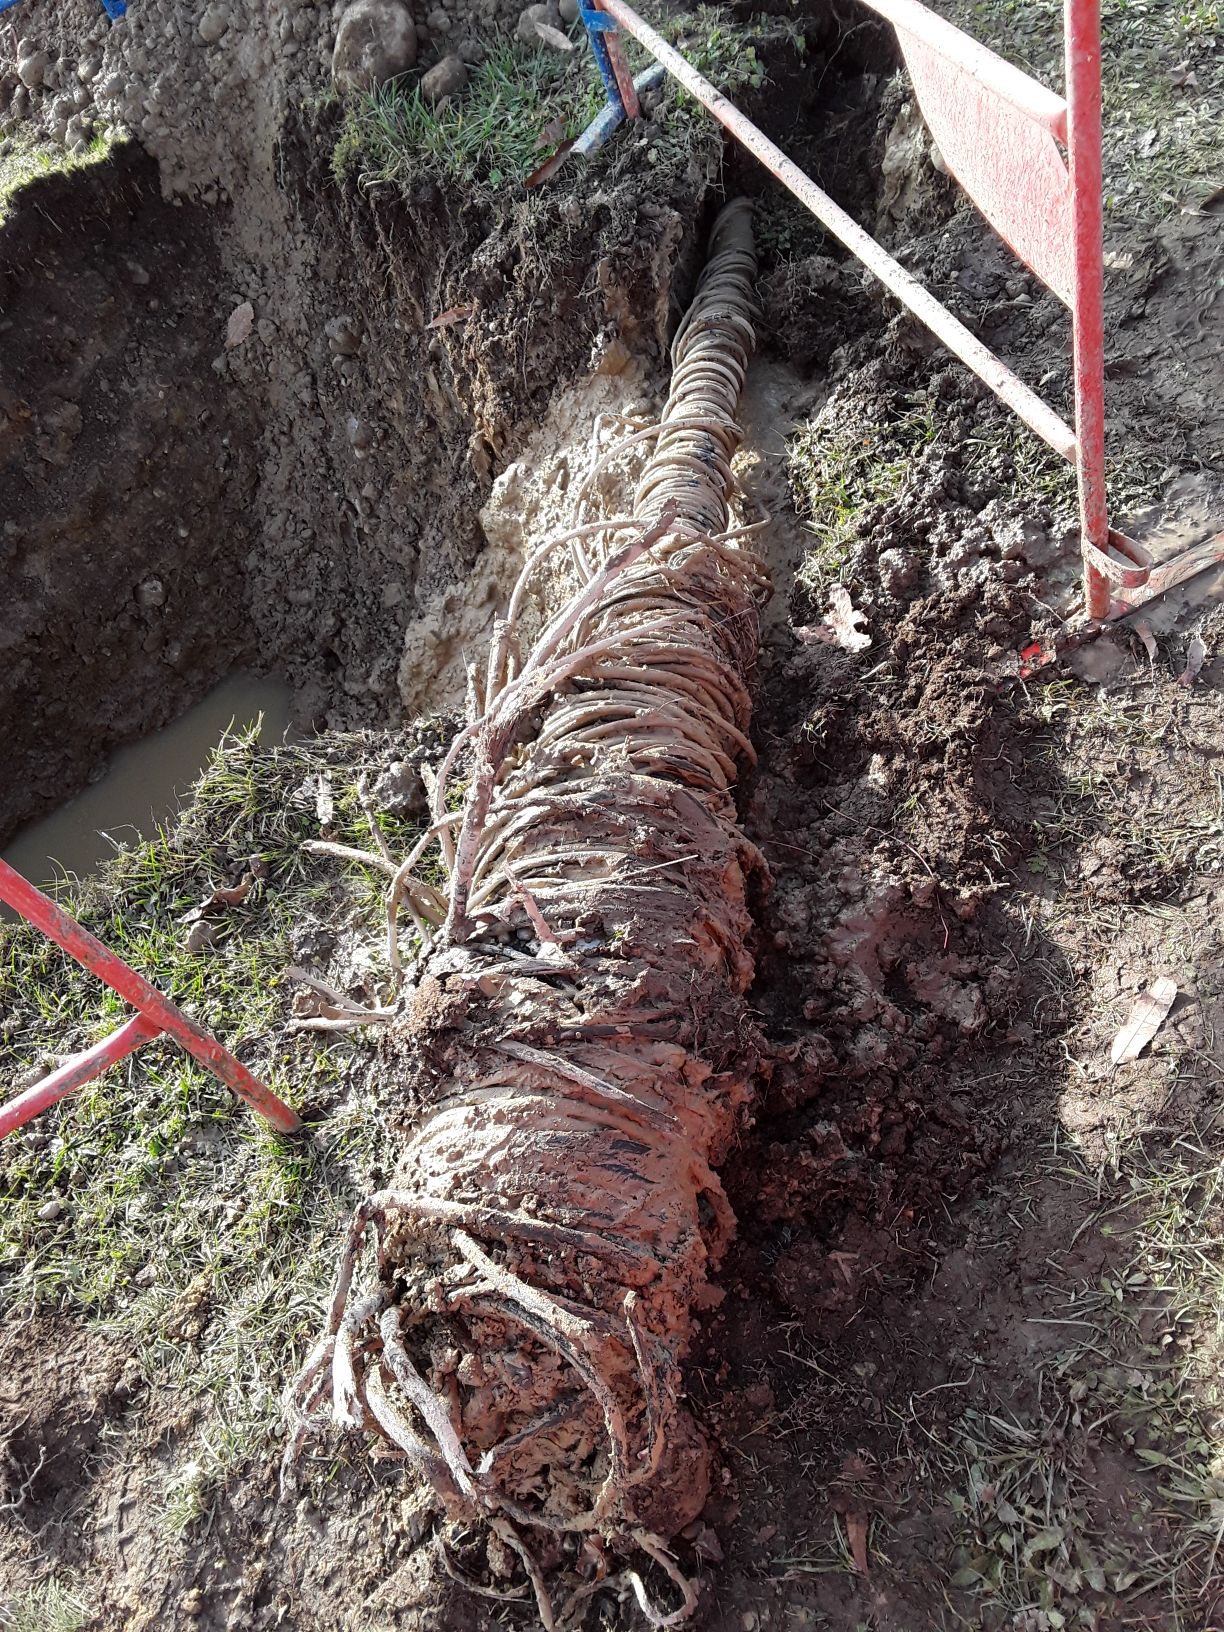
Acts of malice on the network are also significant, even if their origins are difficult to trace. A large number of incidents seem to be caused by unpaid subcontractors or conflicts between different subcontractors. Malicious acts may also be committed for political or ideological reasons (see: all disruptions on French telecom networks in 2021). However, these acts are a minority compared with the biggest source of network damage and breakdowns: civil engineering. Crews often don’t know exactly where the cables and pipes are in the ground when they are digging, so they pull them out or damage them. Accidents of this kind can happen almost daily on a national network. For example, in Frankfurt in February 2023, while digging at a depth of 5 metres, workers hit a critical cable on the network on which Lufthansa’s IT system depends. As a result, Lufthansa’s flights were cancelled for almost a day (See Deutsche Telekom’s post and Lufthansa’s post). On 25 July 2023, during work on a new tram line in Brest, France, site crews ripped out a cable, causing 15,000 subscribers to be cut off from the internet for a week.
Deploying submarine cables worldwide
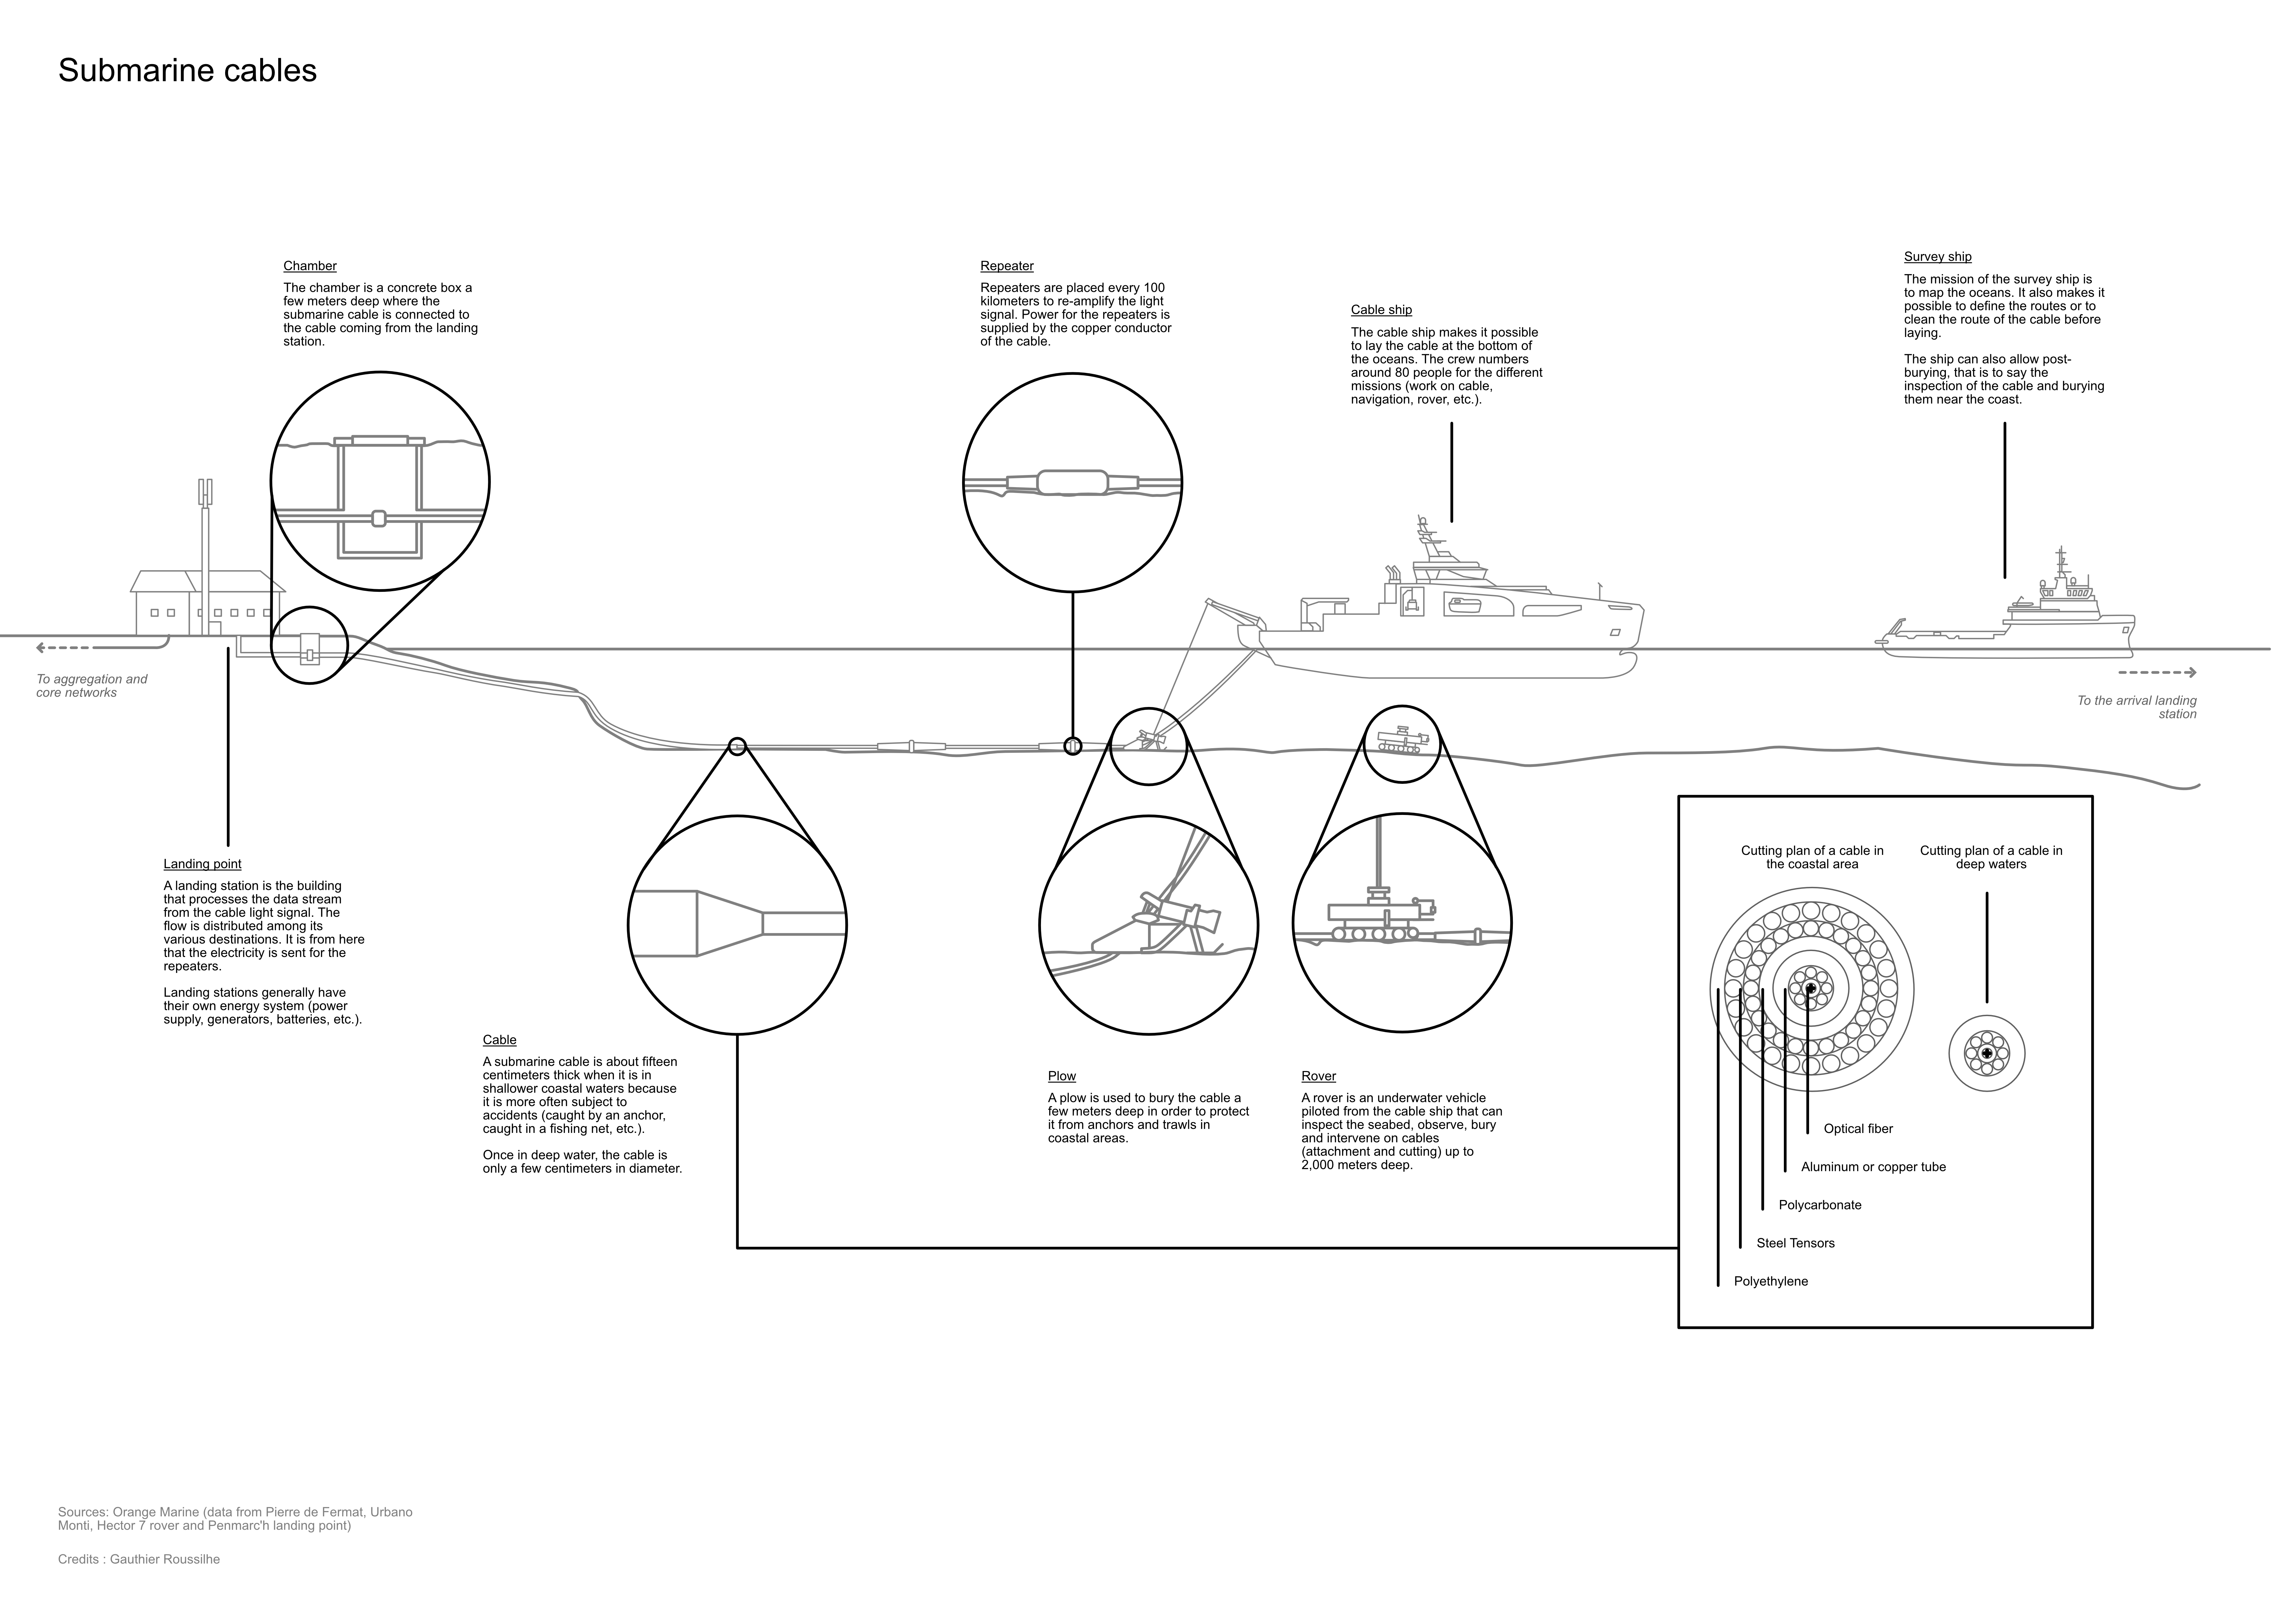
To ensure intercontinental and inter-oceanic links, submarine cables have been massively deployed. These are laid in the seabed by specialized ships. The cables are connected to the terrestrial network in coastal facilities called “landing points”. According to TeleGeography: “as of late 2021, there are approximately 436 submarine cables in service around the world […] and over 1.3 million kilometers of submarine cables in service.” (4 times the distance between the earth and the moon). On average, the lifespan of a submarine cable is between 20 and 30 years, but it can be replaced earlier by more efficient and economically viable cables. Content providers (Facebook, Google, Amazon, Netflix, etc.) are the main customers of submarine cable installers as they are also the biggest consumers of bandwidth.
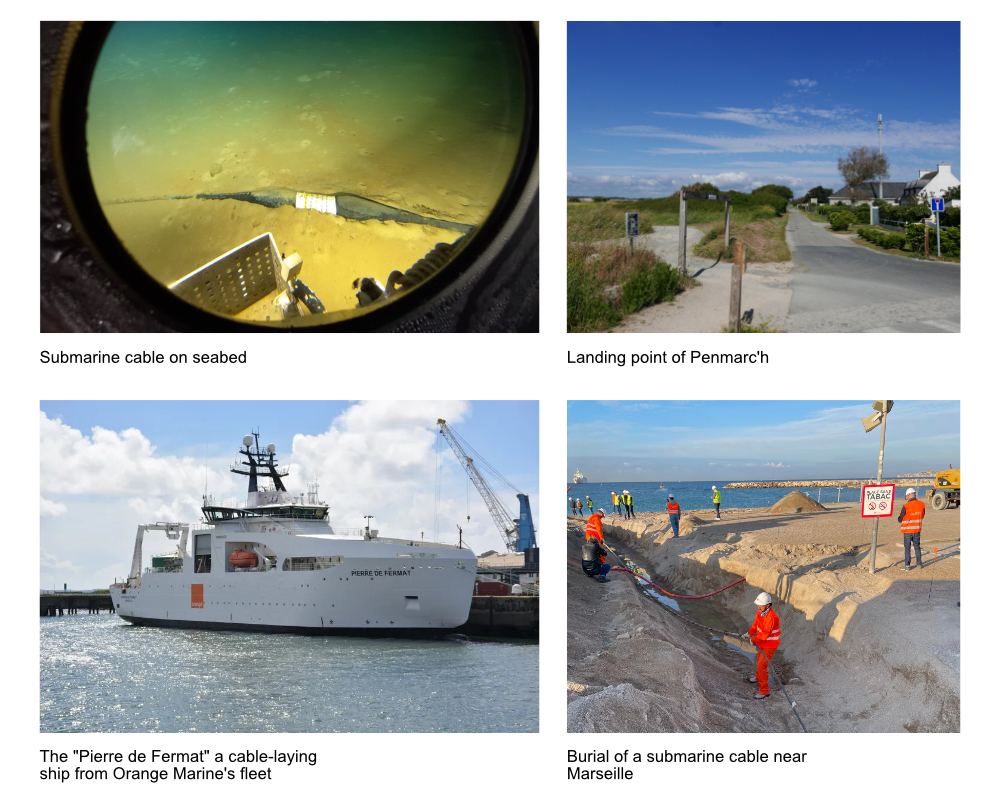
Most accidents on underwater cables are due to boat accidents, commonly the cable is caught in the nets of a fishing boat. Natural disasters can also affect cables (earthquake, volcanic eruption, underwater landslide, etc.). On average, there are over 100 cable faults each year.
Important
Related activity : Geopolitics of submarine cables
Resources
Syllabus
- Ingrid Burrington, Networks of New York – An Illustrated Field Guide to Urban Internet Infrastructure, Melville House, 2016
To go further
- Geoffrey C. Bowker et al., Toward Information Infrastructure Studies: Ways of Knowing in a Networked Environment, 2010
- Steven Li, How Does The Internet Work?, 2017
- Commotion Wireless, The Commotion Wireless Project - Commotion Construction Kit
- Barry M. Leiner et al., A brief history of Internet, ACM SIGCOMM Computer Communication Review 39, n.5, 2009
Video materials
- Wendover Productions, How Cell Service Actually Works
- AT&T Archives, Similiarities of Wave Behavior
- Royal Canadian Air Force, Antenna Fundamentals: Propagation
Session 3 : Data centers
They are different ways to store and compute data. Data centers differs in scale and services. Originally, companies would have their own server rooms in their headquarters, these rooms are called “on premise” (on prem). Telecom operators would have their own data centers that can also perform interconnection between different networks. Then, there are data center operators that offer to rent space, servers and virtual machines in their facilities, this kind of activity is called colocation. Finally, public cloud operators (Google Cloud Platform, Amazon Web Services, Alibaba, etc.) offer managed services to its clients with a consumption-based pricing, instead of renting space or machines the client only pays for what it consumes. Public cloud providers tend to develop large-scale data centers called “hyperscalers”. Organizations can also run their own private cloud on their servers (on premise) or on the servers they are renting in a colocation data center.
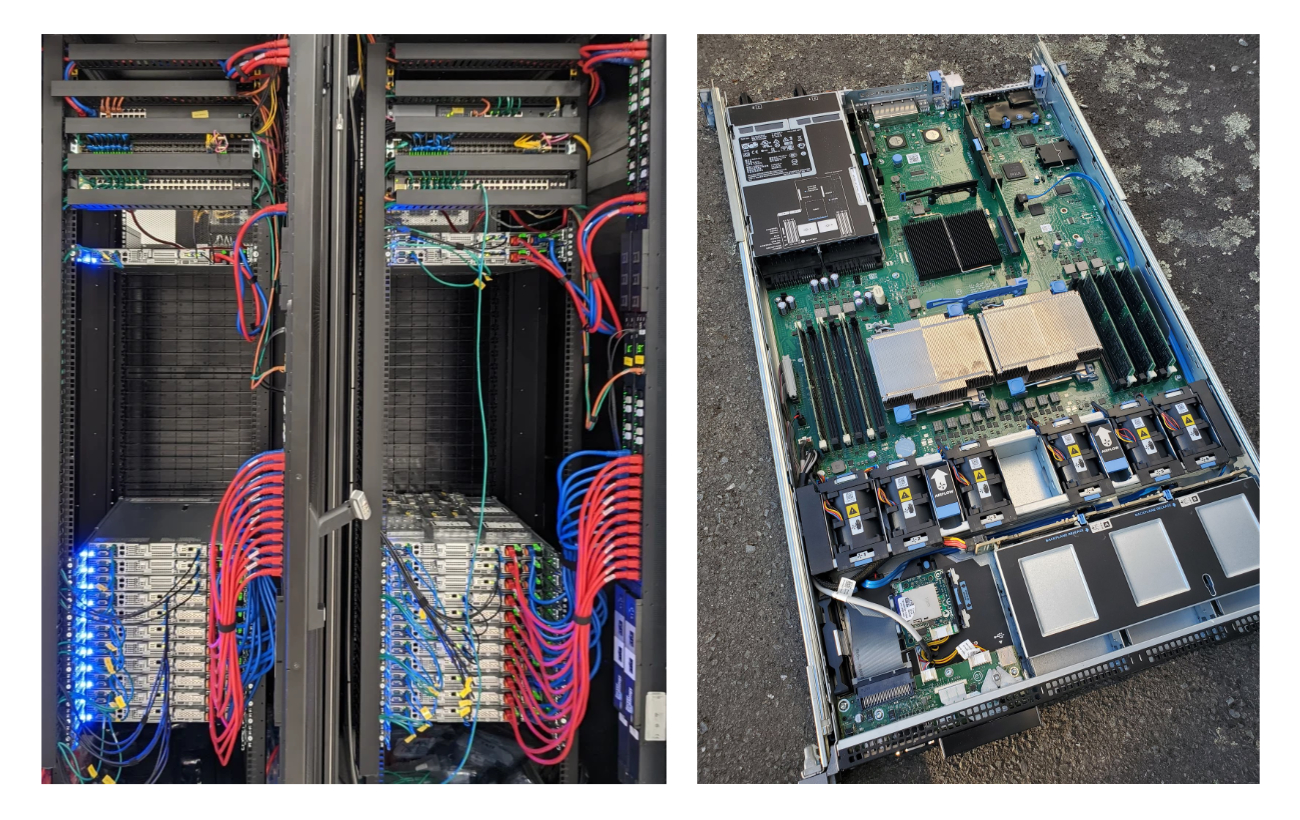
What is inside a datacenter ?
Let’s take a look at Brad Smith’s (Microsoft’s Chairman) tour of the company’s data centre in Quincy, Washington.
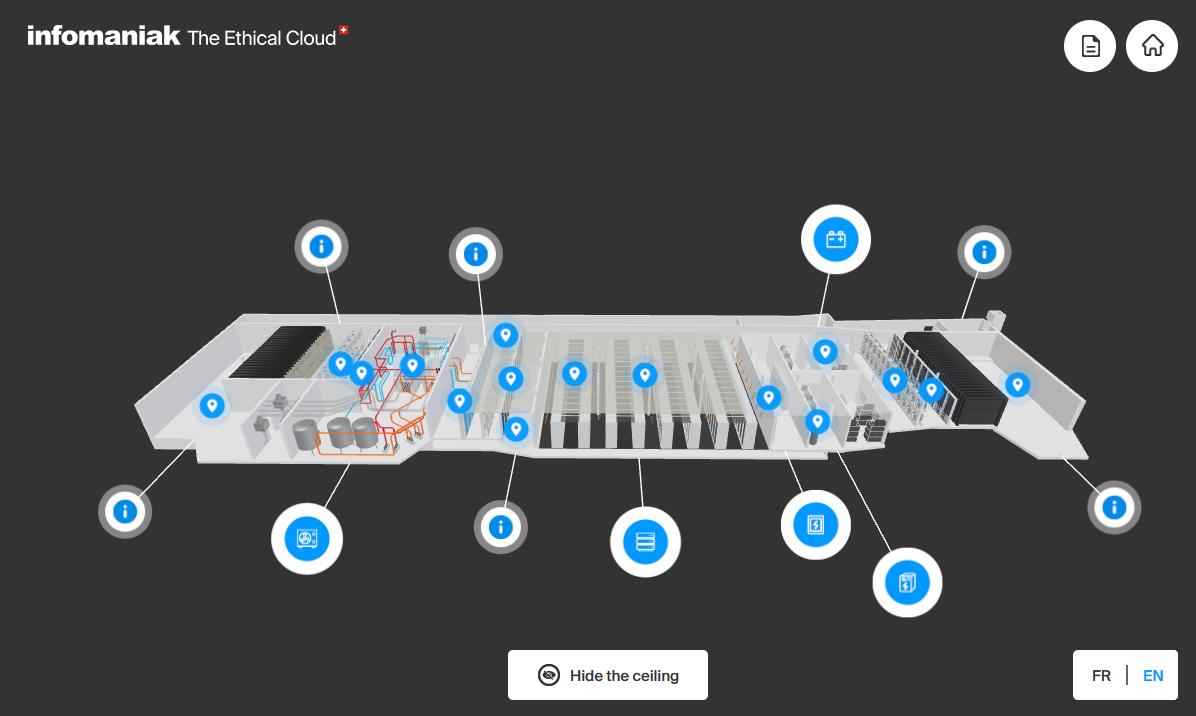
Now let’s take a closer look at the D4 data centre, a brand-new data centre considered to be the most environmentally friendly, built by the Swiss company Infomaniak.
Deploying datacenters
Understanding the general functioning of digital infrastructures is one thing, but they don’t appear overnight. Before installing a data center, telecommunication networks or electronic component factories, physical, political, environmental and economic conditions must be negotiated. Just like maintenance, this phase reveals in part what it really costs to develop these infrastructures. Thus, this deployment is not trivial and must be understood by both policy makers and the citizens who will live with these infrastructures.
Infrastructure is an idea, a vision or an ideal, but it is also a practice, a commitment and a long term endeavor. (Ribes, Universal informatics: Building cyberinfrastructure, interoperating the geo-sciences, p.299)
Data centers are like any industrial complex and need to meet several conditions to be deployed and used. For instance, the location choice of a data center is influenced by the following characteristics:
- privileged access to the electricity grid (source station)
- privileged access to internet fibre network (backbone)
- low natural risks (eruptions, floods, etc.)
- access to cheap land
- low cost or preferential electricity rate
- tax benefits or tax reductions
- potentially access to a water network
Beyond servers and network equipment, it means that inside a data center you will find power lines, going to a transformer and also to batteries, along with fuel tanks and power generator to take over in case of power failure. The transformer will send power to IT equipment (servers, etc), to the cooling unit and to the rest of the facility. Like any industry, data center operators need to negotiate with local authorities to establish itself in the local area and its infrastructures.
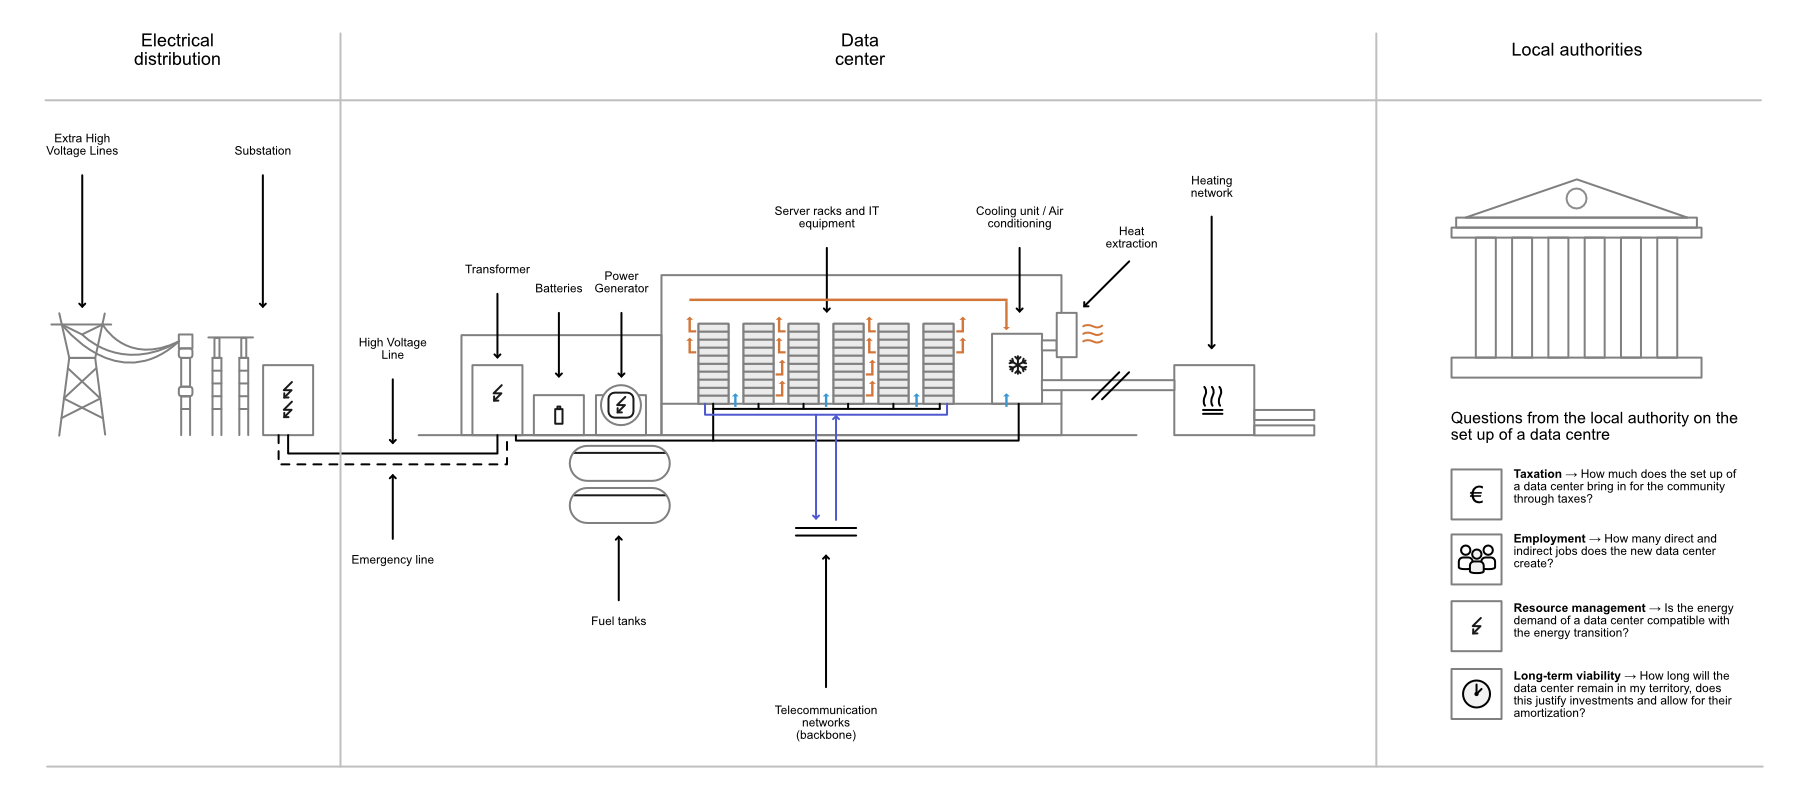
Submitting a data centre project to a local authority is generally a lengthy exercise, and one that tends to remain discreet in order to avoid the interests of competitors and local opposition. Here you can browse Amazon Web Services’ data centre project in the town of Gilroy here. Data center projects are typically designed in phases, increasing capacity and demand of the infrastructure with each step of the phasing. In that case, Amazon is securing land (438,500 square feet) and is giving a list of the infrastructure and equipment need for the project : backup generation, battery systems, their own substation, a water pipeline, security fencing and protection from storms.
A data centre is never just about servers; this type of industry involves a whole range of local and national players and relies heavily on access to existing infrastructure. However, the scale of the tech giants’ new data centre projects means that they now have to create their own infrastructure for both energy and water supplies. This does not mean, however, that this eases the burden they place on an area.
Important
Related activity : Datacenter attractivness in France
Electrical network tensions
One of the most important controversies surrounding data centres is their significant electricity usage. From an ecological perspective, electricity production is a significant source of environmental impacts. According to the IPCC, electricity and heat production accounted for one third of total greenhouse gas (GHG) emissions in 2019. In France, both RTE and ADEME estimate that data centres consume around 10 TWh per year, accounting for around 2% of total French consumption. Globally, the IAE estimates consumption at around 415 TWh in 2024.
Important
Related activity : Electricity Map
However, electricity consumption is not the only issue. In order to access the grid, data centres must issue a demand to the grid operator for connection. Usually, operators cannot discriminate between different demands, so the ‘first come, first served’ rule applies. Since power availability is limited, this creates tension and conflicts of use.
In France, the total power demand from the data centre industry is 28.6 GW. Of this, 18 GW has already been reserved by RTE, the French grid operator. For comparison, installed power in France was 164.5 GW in 2025. This creates a risk of conflicts over usage, both globally and locally. In areas where the grid is already saturated, such as Marseille, the construction of new data centres could jeopardise other projects.
Globally, the French grid exports large amounts of electricity, sometimes at a loss. This has led to discussions about the potential of data centres to support the grid. However, France planned the production of this electricity in the context of the energy transition (e.g. electrification of vehicles, heating and industry). While the transition in production is proceeding as planned, the transition in consumption is slower than anticipated. Thus, implementing data centres could consume the electricity dedicated to future planned usages, it would lock in the power for datacenters.
Furthermore, there is no guarantee that data centres will be able to adapt to the intermittency of the new power capacity (solar and wind power), putting in question their participation in the stability of the grid.
Important
Related case study : Tension of the Irish electrical grid
Water stress
Certain definitions must be established when discussing environmental issues related to water. Used water is not lost from the biosphere. Rather, it can be transferred from one watershed — a geographical area where water flows to a specific point — to another, typically through evaporation. It is important to distinguish between withdrawn water — the total amount of water used in a process — and used water — the total amount of water removed from a watershed.
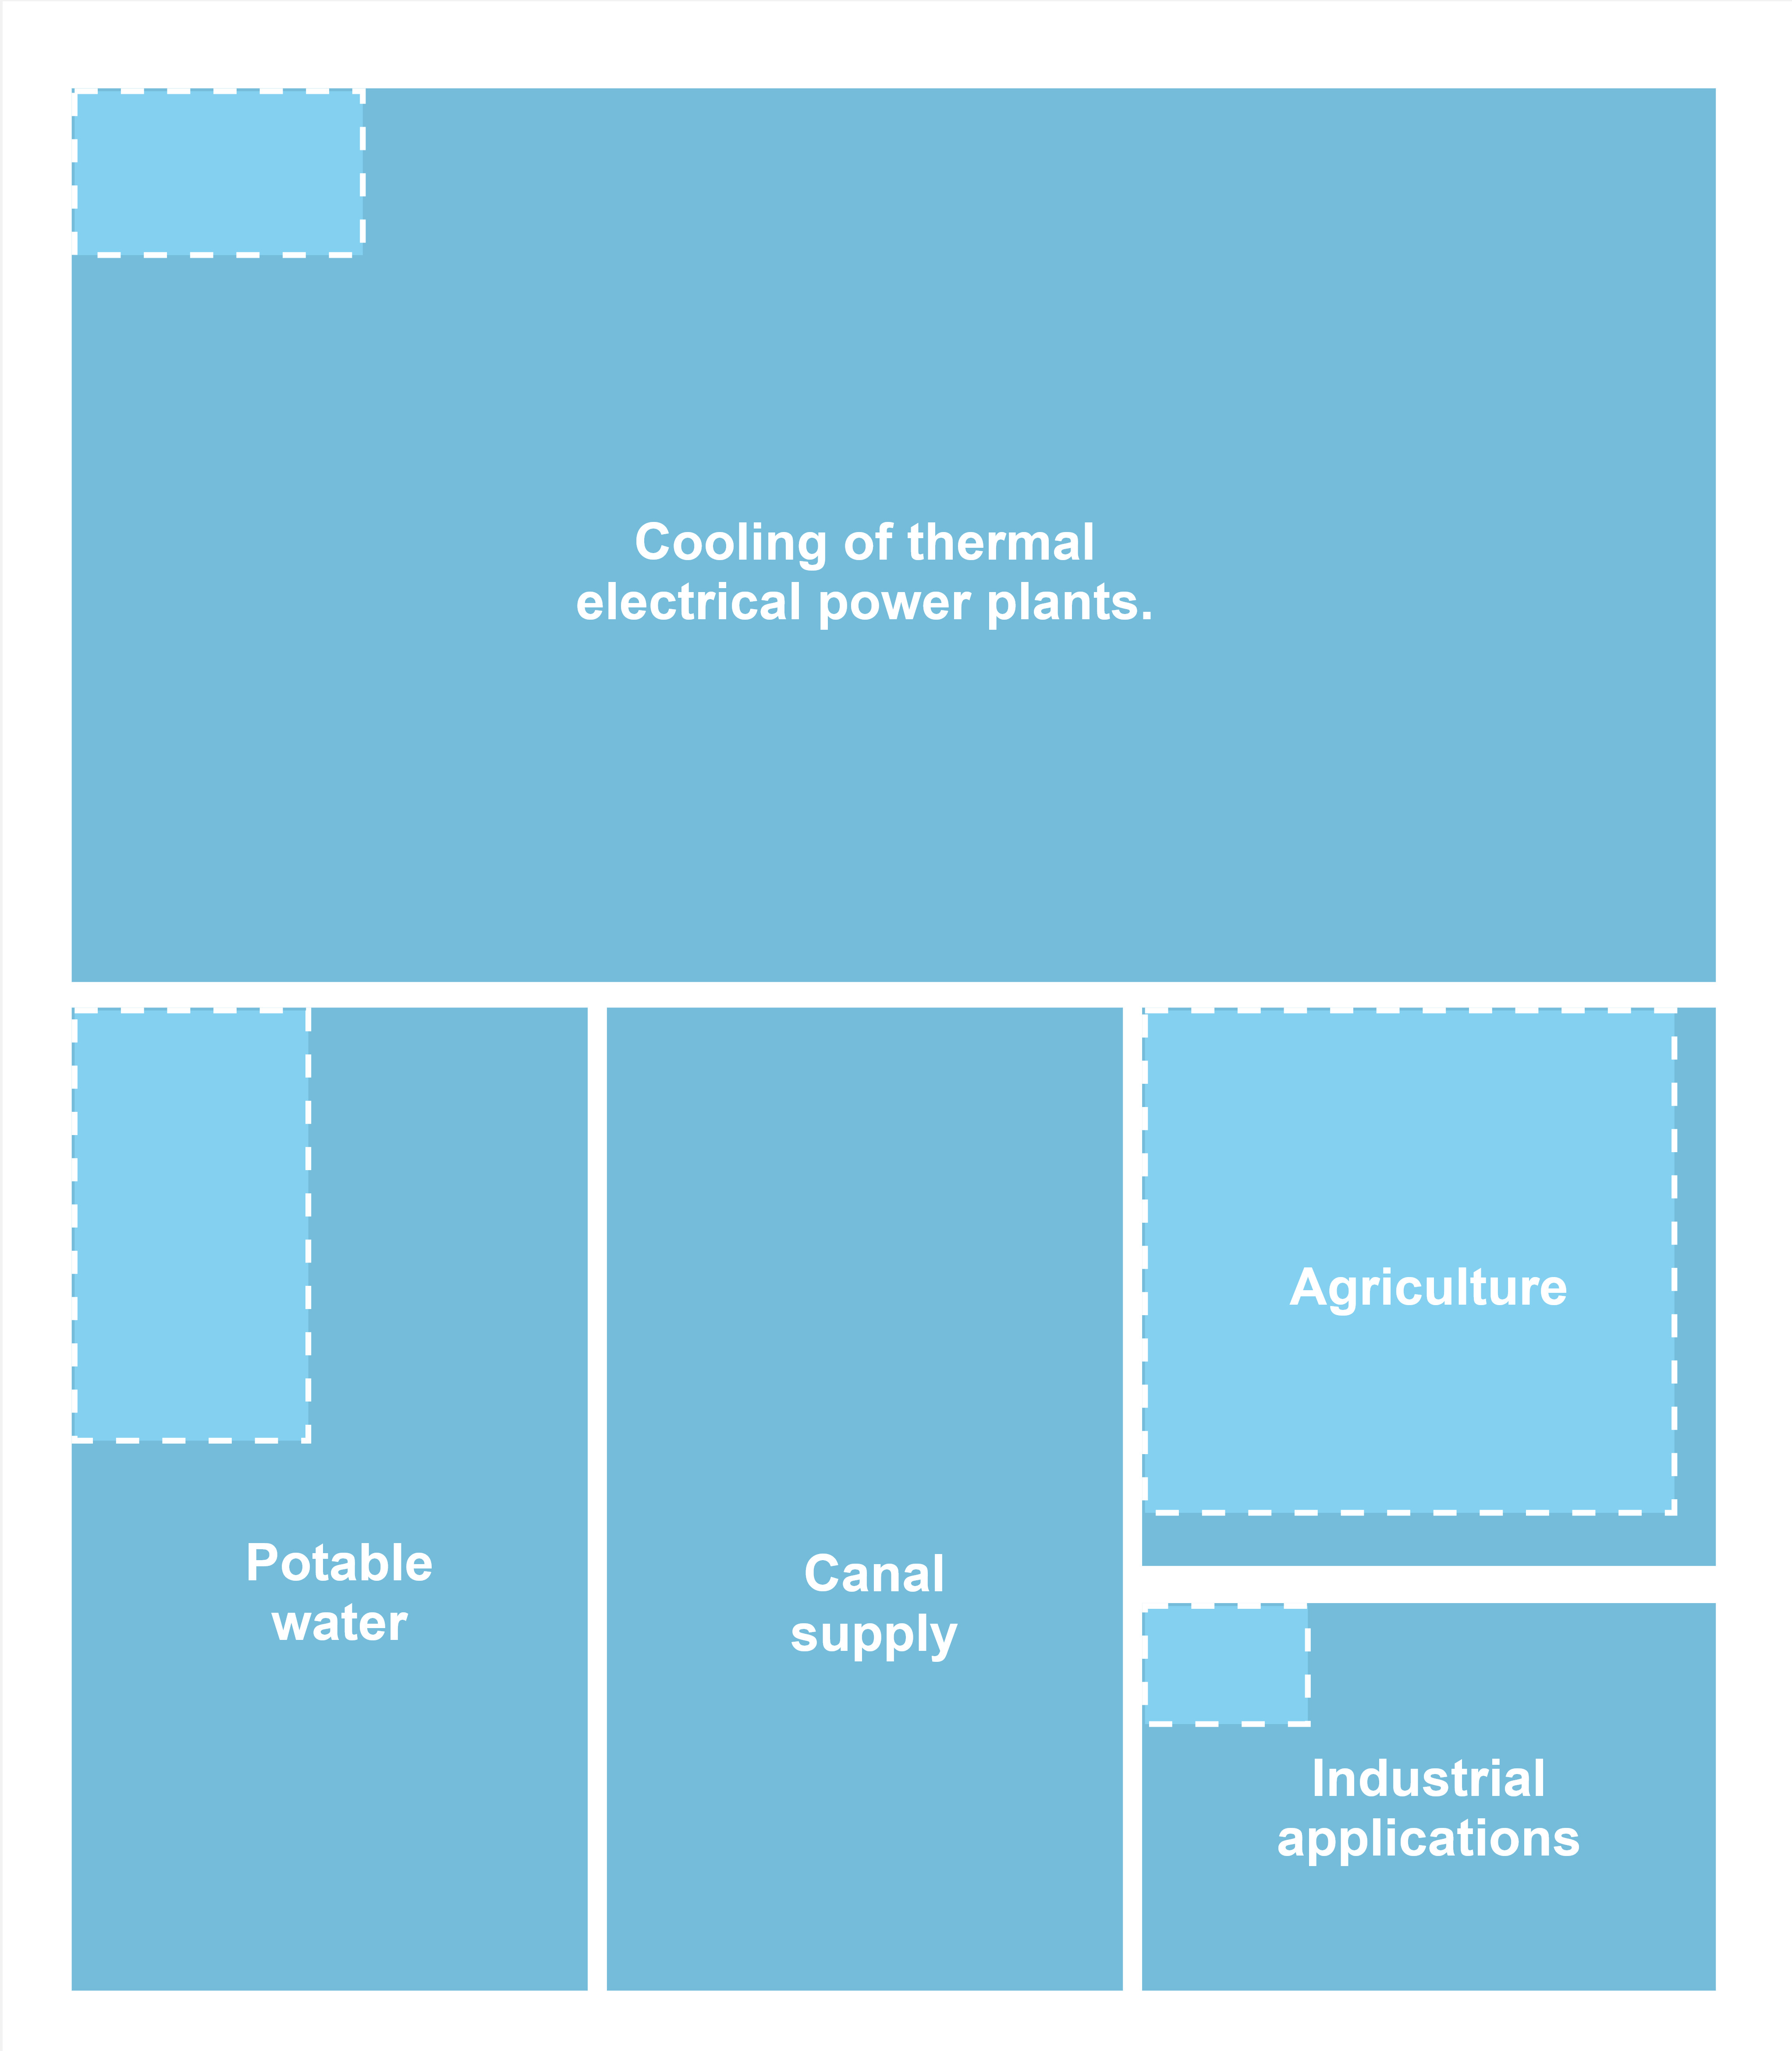
Another important distinction is that between the different ways in which water is used inside a data centre:
- inside IT rooms, where it is often mixed with glycol in order to extract heat directly from the IT equipment via direct liquid cooling (DLC).
- inside cooling production units.
- in heat extraction units employing evaporative cooling.
Regarding the first two types of usage, water is used in a closed circuit, meaning that issues relating to water withdrawal are limited to system leakage and the replacement of water. A mere fraction of the amount used in evaporative cooling.
Legacy larger (hyperscaler) data centers typically use regular evaporative water cooling, especially in the western part of the United States. This technique consumes a lot of water that is removed from the original watershed. However, these areas experience varying degrees of water stress. Some of these data centers may require a significant amount of water in relation to territorial capacities and may potentially create conflicts of use.
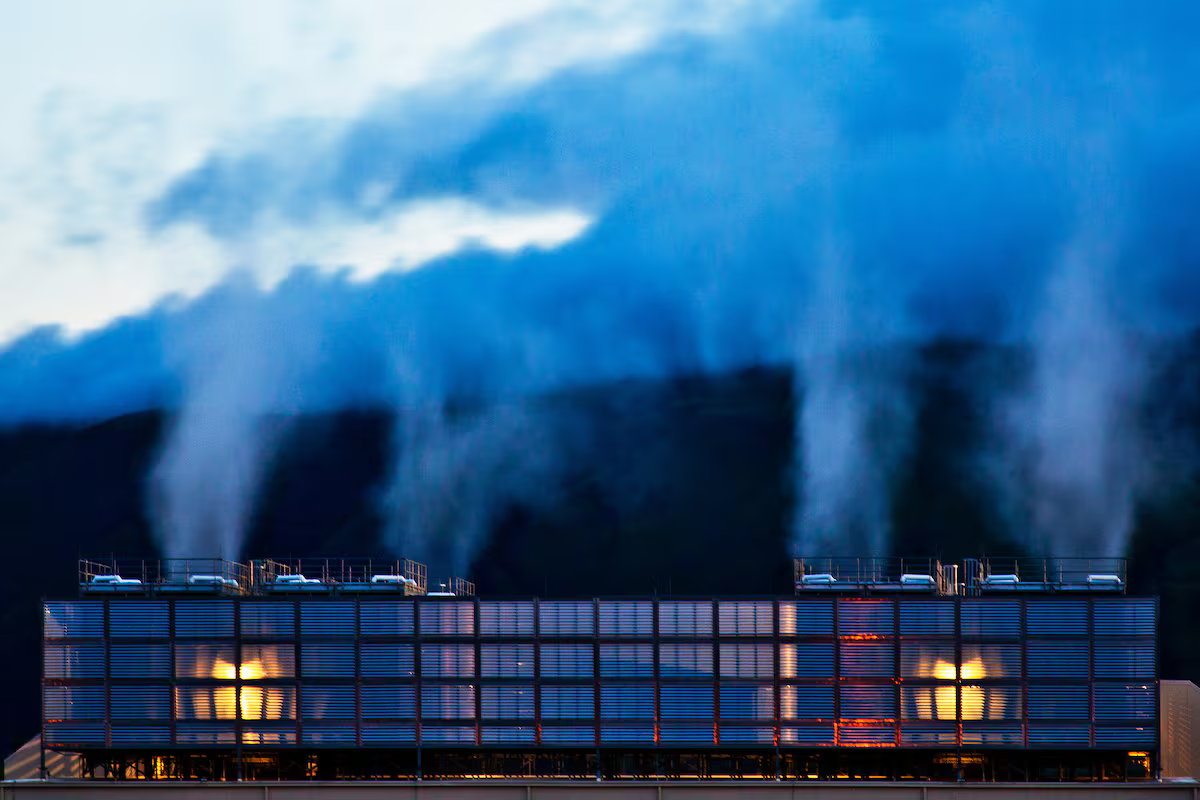
There are other ways of extracting heat from datacenters such as freecooling or adiabatic cooling which uses much less water than regular evaporative cooling technologies.
Important
Related activity : Cooling technologies
Beyond the cooling techniques (direct water footprint), the origin of the electricity is a major problem. Indeed, water is needed to produce electricity in power plants equipped with steam turbines or hydroelectric dams. On average the water consumption intensity for electricity generation for 2023 in U.S.A. was 4.52 liters per kilowatt-hour and 47.45 for water withdrawal (Berkley Lab, 2023). In this sense, water stress can affect the production of electricity but also data centers that use water cooling.
Water stress is set to accelerate in many parts of the world, and water supply and management issues will become increasingly pressing for many data centres. As a result, the construction of new data centres is increasingly contested, as was recently the case in Talavera de la Reina, Spain, where Meta planned to build a €1 billion ($1.1 billion) data centre. Meta expects the facility to use about 665 million liters (176 million gallons) of water a year, and up to 195 liters per second during “peak water flow,” according to a technical report (see Bloomberg’s article). Meanwhile, the central region of Castilla La Mancha, which produces a quarter of all Spanish grain, is expected to lose 80% to 90% of this year’s harvest (2023), and water restrictions loom large. The same is happening in London, where Thames Water is considering measures to cut down the water used by some datacenters according to the Register.
A final critical point is confidence in the water consumption forecasts provided by data centre operators. The case of a Microsoft data centre in Amsterdam is illustrative: Microsoft had forecast annual water consumption of between 12 and 20,000 m³. In reality, however, this infrastructure consumed 84,000 m³ of water in 2021, while an independent expert hired by Microsoft re-estimated the centre’s annual water consumption at around 100,000 m³. Microsoft explains that the data centre’s hydraulic cooling circuit is only opened when outside temperatures exceed 25°C. However, for its calculations, the company used weather data from the year before it moved in, during which Hollands Kroon only had six summer days above 25°C. In 2021, there were 22. And this year, the record is likely to be even worse. Hence, the big difference between estimates and reality.
Land use
When data centres replace agricultural land or forest, this land usage replacement participates in the artificialisation of soil, responsible for the loss of biodiversity and carbon sink. But this is not specific to datacenters, but general to all artificialisation.
However, since datacenters need to be implemented in areas with access to specific resources, they often install themselves in existing industrial parks where power is available, limiting access to other industries.
Rising controversies around the western world
Water, Electricity, Land : The ecological controversies around datacenter are exacerbate by the conflict of use around those ressources already in stress due in part to the ecological crisis. While datacenters are getting access to those ressources most of the value they generate does not benefit to local communities.
The collective “Tu nube seca mi río” (Your cloud dries up my river) in Spain have raised the question of water withdrawal, a critical issue in a country subject to important water stress. They have launched a judicial action against AWS for their datacenter in Tarragona. In the US, where the electricity market is liberalized and prices are determined by offer and demand, the rise of electricity costs for local communities has been one of importance. In France, questions around the preemption of electricity by datacenters instead of other industries arise. The NGO data4good has launched an action against the biggest project of “AI Campus” in Europe in Fouju.
Important
Related case study : Greening Datacenters in Marseille
GenAI : Harder, Better, Faster, Stronger
We’ll learn more about it at the end of this class, but generative AI transforms the material conditions of data centres. In particular, the electrical intensity of existing and future genAI infrastructures is on a different scale to that of regular data centres (5 to 10 times more per m^2). This has consequences for the architecture of data centres (e.g. new cooling methods, switching to high voltage, etc.). It also intensifies conflicts over the use of electricity and water in some parts of the world, and gives rise to new collective actions.
Resources
Syllabus
- Gauthier Roussilhe, Territorialising digital systems, the example of data centers, 2021
To go further
- Arzhel Younsi, Building DReaMeRS: How and why we opened a datacenter in France, Wikimedia Tech blog, 2022
- META, Meta Data Centers
- Hubblo, Key Facts About the Water Footprint of Data Centers—What Are We Talking About? When? How? How Much?, 2026
- ADEME, Prospective d’évolution des consommations des data centers à court, moyen et long terme de 2024 à 2060, 2026
Session 4 : User equipment
The term “user equipment” or “end-user devices” refers to all equipment used by end customers, whether they are professionals or consumers. This includes desktop and laptop computers, monitors, phones, smartphones, tablets, peripherals. The “Entertainment & Media” sector also has its share of equipment: cameras, audio systems, media players, smart speakers, connected watches, game consoles, etc.
The development of the Internet of Things (IoT) poses a new challenge to the inventory of all this equipment as it will be included in all sectors: surveillance cameras, sensors, etc. It is difficult today to know the exact number of connected objects and other equipment deployed. The Internet of Things involves turning more and more everyday objects into connected objects, which makes future inventory between more unstable. Indeed, new devices that do not exist today are impossible to predict.
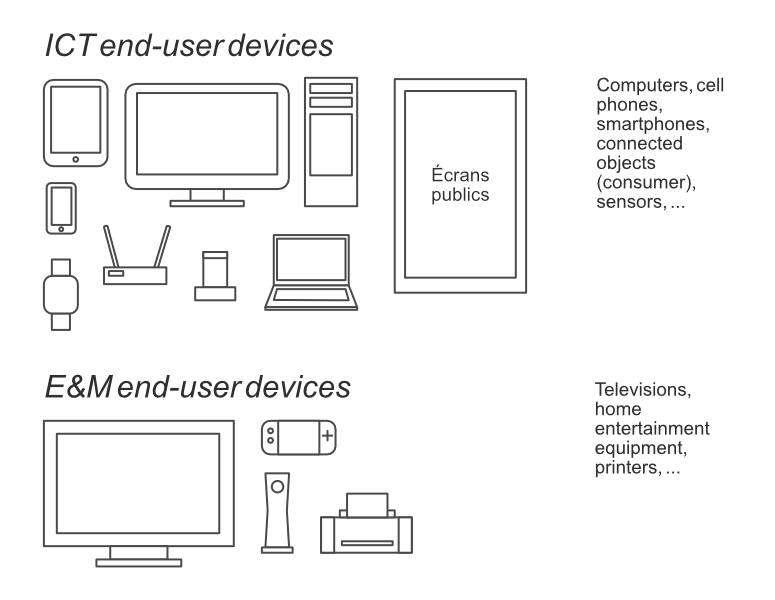
Making a digital world
For most people, digital infrastructure is rarely visible. The only immediate contact is through user equipment, yet the infrastructure to enable data processing forms a giant network that crosses oceans and continents until it reaches homes by cable or radio waves. It is this immense infrastructure that allows us to communicate at almost the speed of light. However, it has to adapt to local, territorial and even terrestrial constraints which make its deployment complex and dependent on many parameters.
Accustomed as we are to the “information revolution,” the accelerating pace of the 24/7 lifestyle, and the multi-connectivity provided by the world wide web, we rarely step back and ask what changes have been occurring at a slower pace, in the background. For the development of cyberinfrastructure, the long now is about 200 years. This is when two sets of changes began to occur in the organization of knowledge and the academies that have accompanied – slowly – the rise of an information infrastructure to support them. On the one hand is the exponential increase in information gathering activities by the state (statistics) and on the other is the emergence of knowledge workers (the encyclopedists) and the accompanying development of technologies and organizational practices to sort, sift, and store information. (Geoffrey C. Bowker, Toward Information Infrastructure Studies: Ways of Knowing in a Networked Environment, p. 103)
Substituing or adding devices?
The image below shows a number of devices whose functions are now integrated into a smartphone. The smartphone has indeed had a significant substitution effect, but is this substitution total or partial? Has the smartphone led to the creation of ever more new connected devices?




Increasing the perimeter of digital devices
Assessing the environmental impacts of digital technologies also means broadening the scope to include new products (such as autonomous cars) and services that require significantly more equipment (such as the healthcare example below).

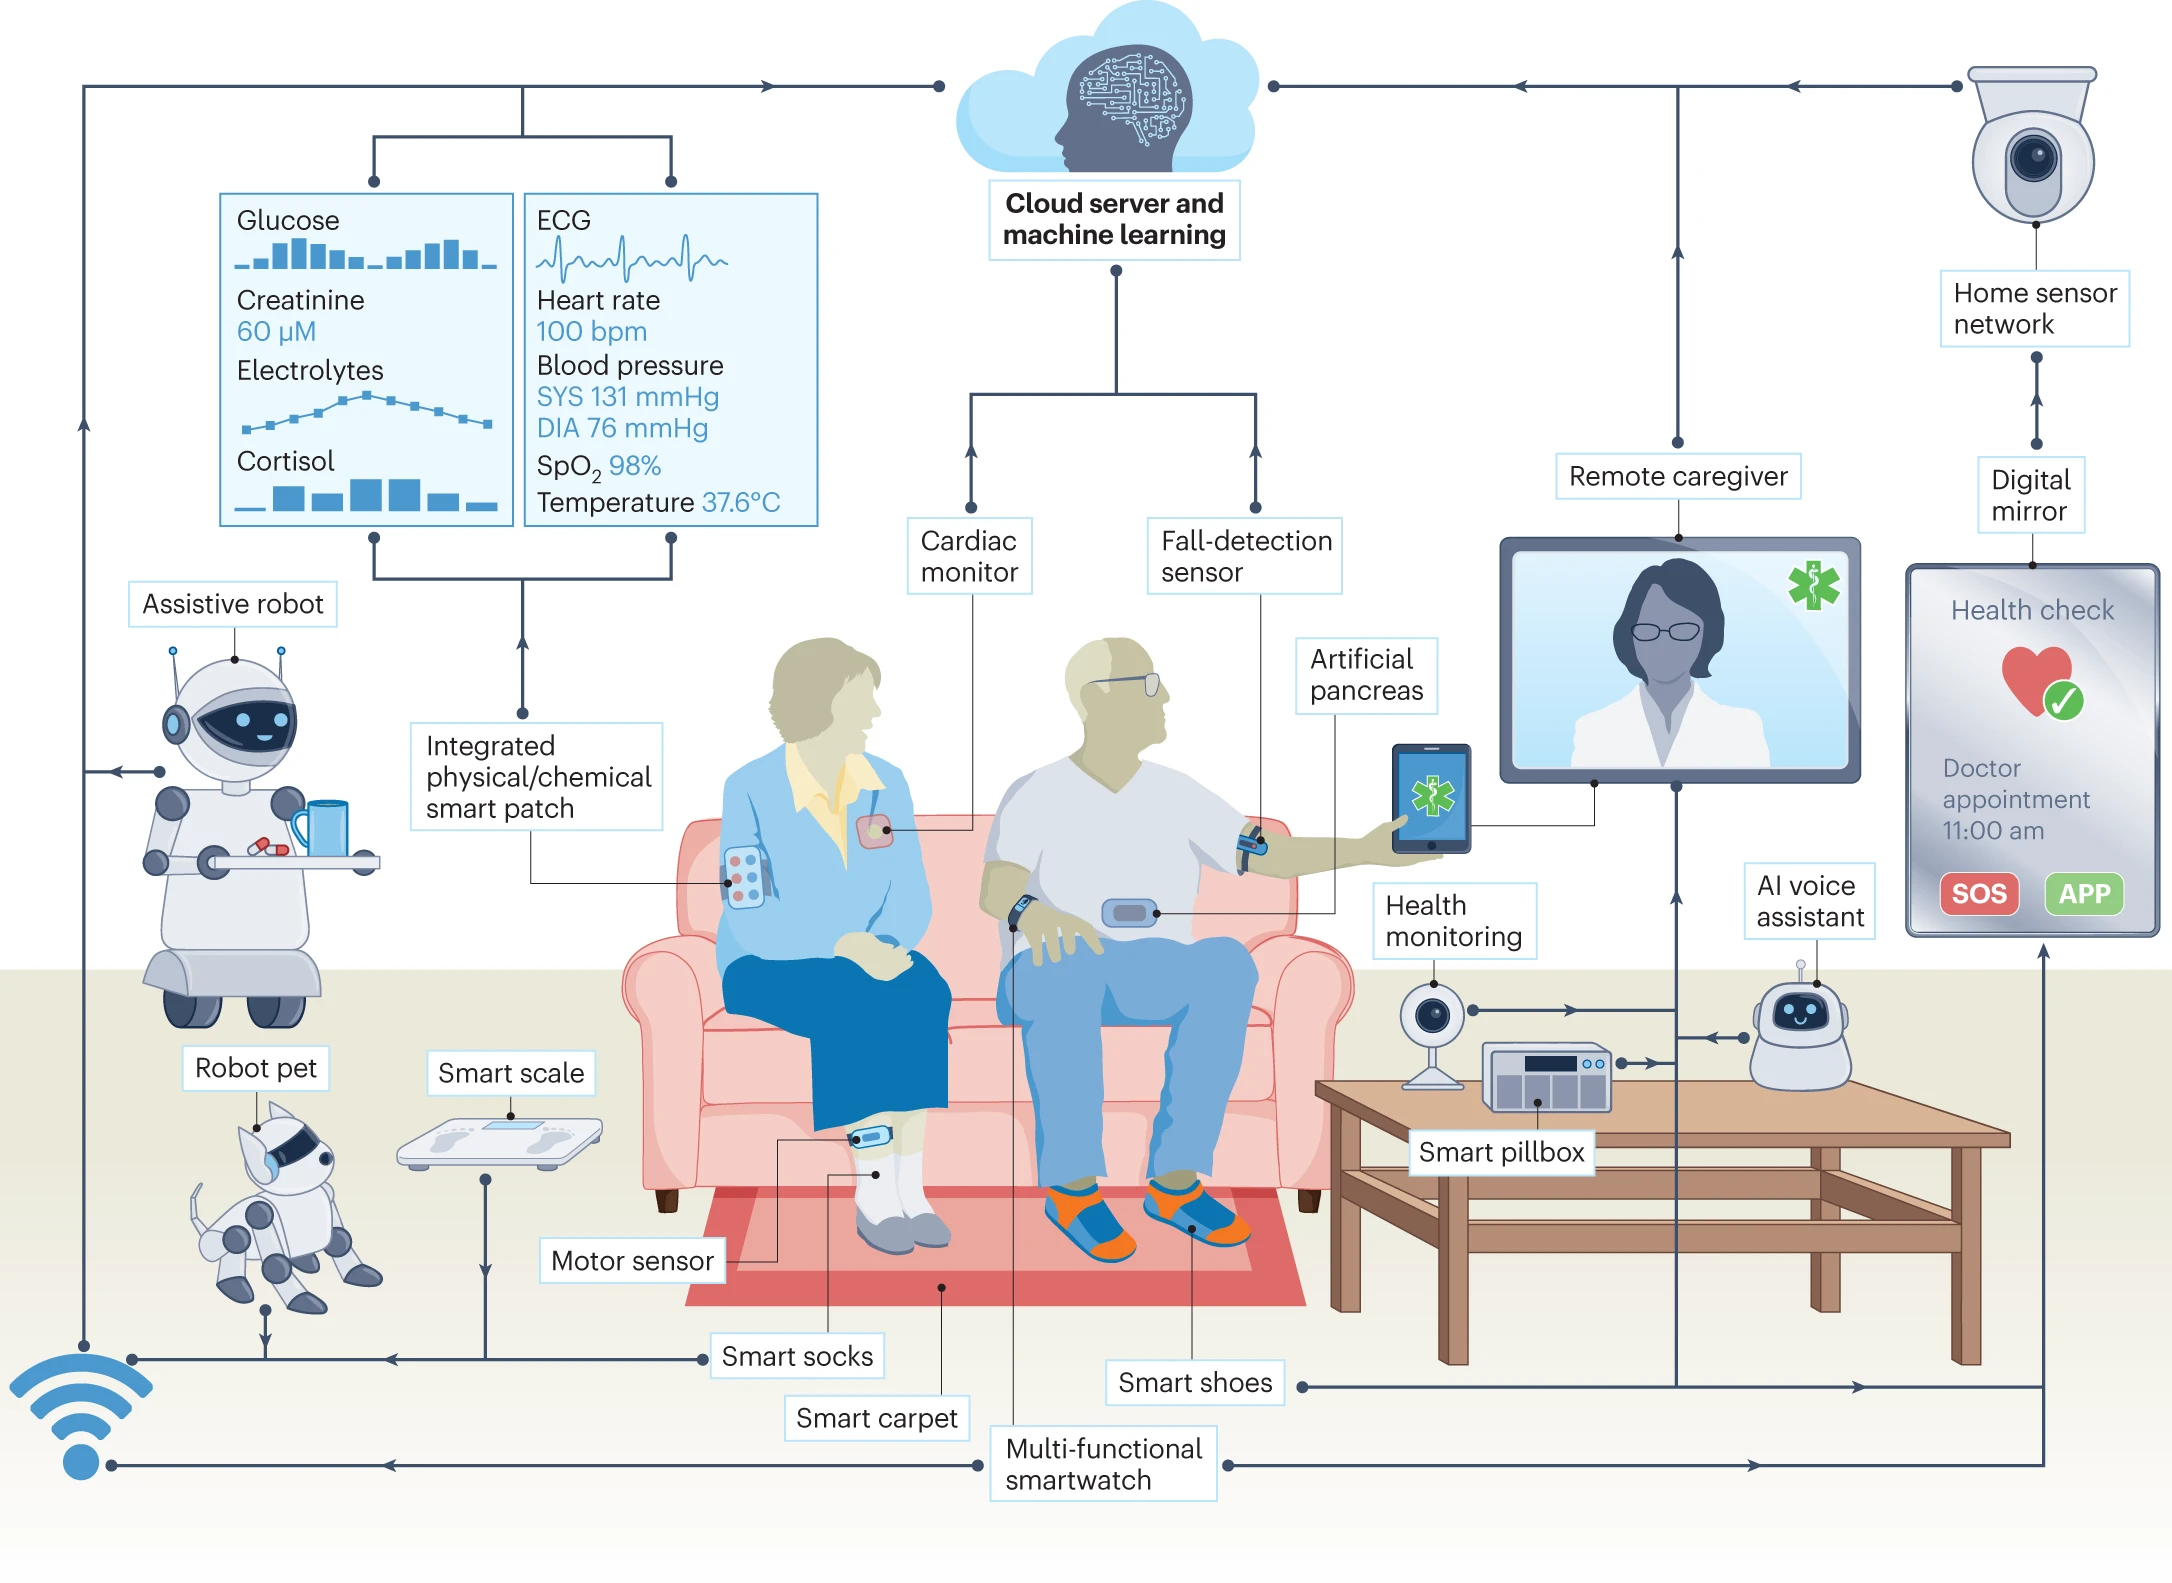
Today, the biggest unknown regarding the future trajectory of end-user devices is humanoid robots. Industrial robots are already widespread in factories around the world, but ‘household robots’ are still in their infancy. It is difficult to say whether this type of product will actually perform useful functions and become commonplace.
Make the future repairable
Generally speaking, the environmental footprint of consumer electronics stems from their manufacture, except in certain cases, particularly due to their relatively short lifespan. It is therefore crucial to design equipment that is repairable and modular in order to extend its lifespan.
Numerous initiatives, companies and independent projects show that this is entirely possible. From smartphones and computers to headphones, printers and e-readers, new products have emerged and enjoyed varying degrees of commercial success: Framework, Fairphone, AIAIAI, etc.





Session 5 : Extraction
Browsing through a global footprint
To produce the phenomenal quantity of components, devices and digital equipment used today, it is necessary to ensure a constant and globalized flow of materials. This flow links the mining areas to the manufacturing plants, and these plants to recycling and waste facilities, but could it be maintained? What are the material demands of the digital sector and how do they relate to the general demand? Furthermore, what is the social and environmental cost of extracting these resources?
Current and future demand for minerals
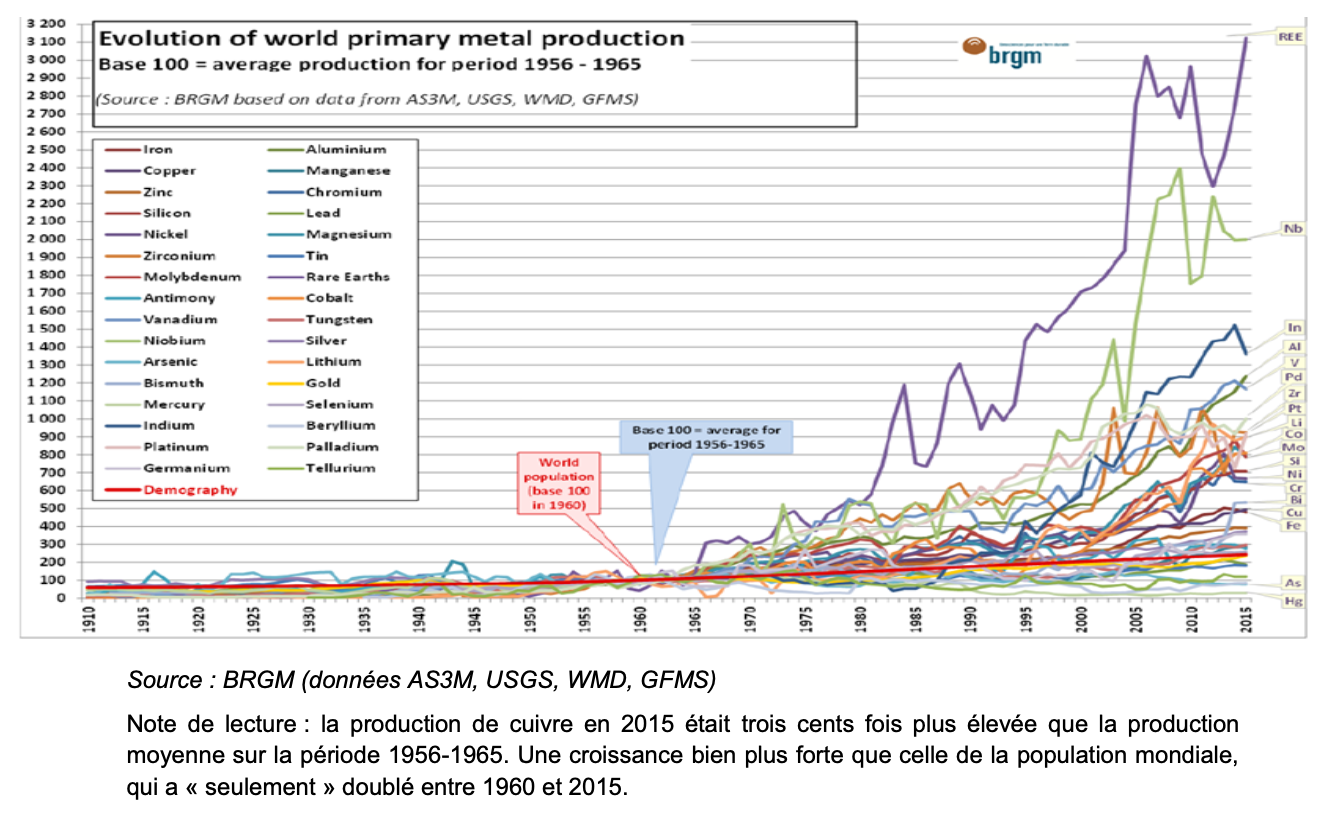
The extraction of metals requires the opening of a mine, either underground or open. Mines are opened because the industry requires more raw materials or projects to do so. Indeed, investors will generally only fund a mining operation if there is demand and profitability. It is therefore demand that drives the production of mineral raw materials: supply adapts to demand. However, increasing construction and new industries have greatly increased demand.
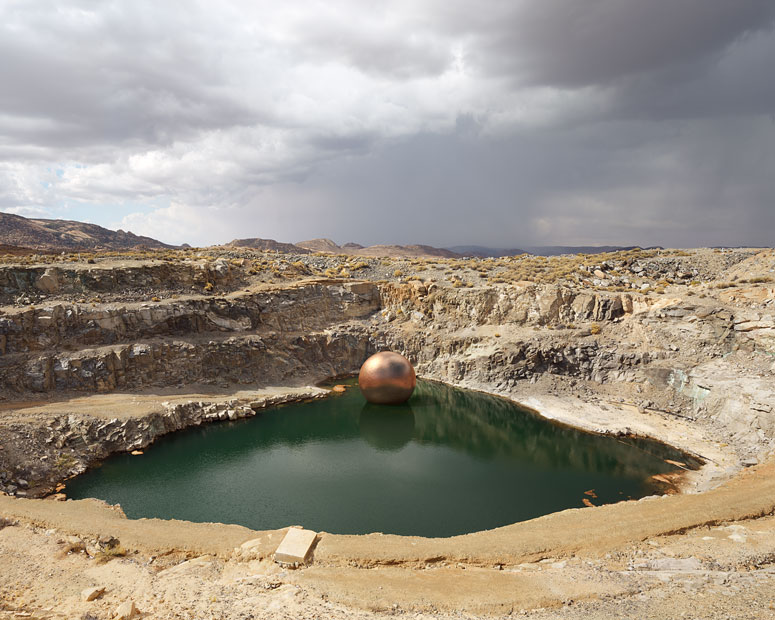
Understanding our current reserves
Human societies, mainly industrial, consumed 210 megatons (Mt) of minerals worldwide in 1900, then 6.5 gigatons (Gt), or 6500 megatons, in 2009 . During this period of a little more than a century, the population has multiplied by 4 while the consumption of ores and industrial minerals has multiplied by 30. The latter is mainly due to specific societies and social classes. As such, the 30-fold increase in mineral consumption is not attributable to humanity as a whole, but to certain societies in certain territories over a certain period of time.
When demand emerges from the industrial and financial sectors, supply does not instantly line up as if it were a matter of releasing stocks. It takes several decades from the beginning of geological exploration, the first drillings, the opening of the mine, to the exploitation and the extraction of the first ton of ore. In the case of exploration in an already known area, this deployment time can be quite “fast”, between 10 and 15 years. In the case of an exploration in a little known area, it is necessary to count between 20 and 30 years. It is important to understand that if a demand for a metal emerges in 2020 and investments are released for geological exploration at the same time, then the first tons extracted (supply) to meet this demand will be available between 2030 and 2050. So anticipation is key in the mining sector.
Understanding how to qualify the importance of mineral resources and reserves is not straightforward. There is a clear distinction between two terms: resources on the one hand and reserves on the other. In geology, “resources” correspond to the concentration of a liquid, solid or gaseous substance in the earth’s crust. Thus the definition of resources varies greatly according to geological knowledge and the measurement tools available. As exploration and extraction techniques become more sophisticated, the resources discovered or extractable may increase. The more certain we are of an ore concentration in the ground, the more economically qualified the resource is. We then speak of “inferred” resources for the least well identified resources, “indicated” resources and “measured” resources for those that are better known. There are also “unidentified” resources, which are an estimate based on the mathematical probabilities provided by previous explorations.
Reserves correspond to known concentrations of ore that can be economically and technically exploited at a given price at a given time. It is therefore the market price, technological progress in extraction methods and processing costs, geological concentration, quality and depth of the vein that indicate how much of the measured resources become exploitable reserves. There are several types of reserves, two of which are prominent: the reserves base includes all proven resources (measured and indicated) that are mineable by current mining practices. The reserves base includes reserves that are economically recoverable at the time of evaluation (economic reserves), those that are close to being economically recoverable (marginal reserves), and those that are not currently economically recoverable at all (sub-economic reserves). It is from the reserve base that the global reserve of a resource is calculated. The so-called “reserves” are the part of the reserve base that is technically, geologically and economically exploitable at the time of the evaluation. This does not mean that all reserves are exploited, but rather that they could be exploited at the time.
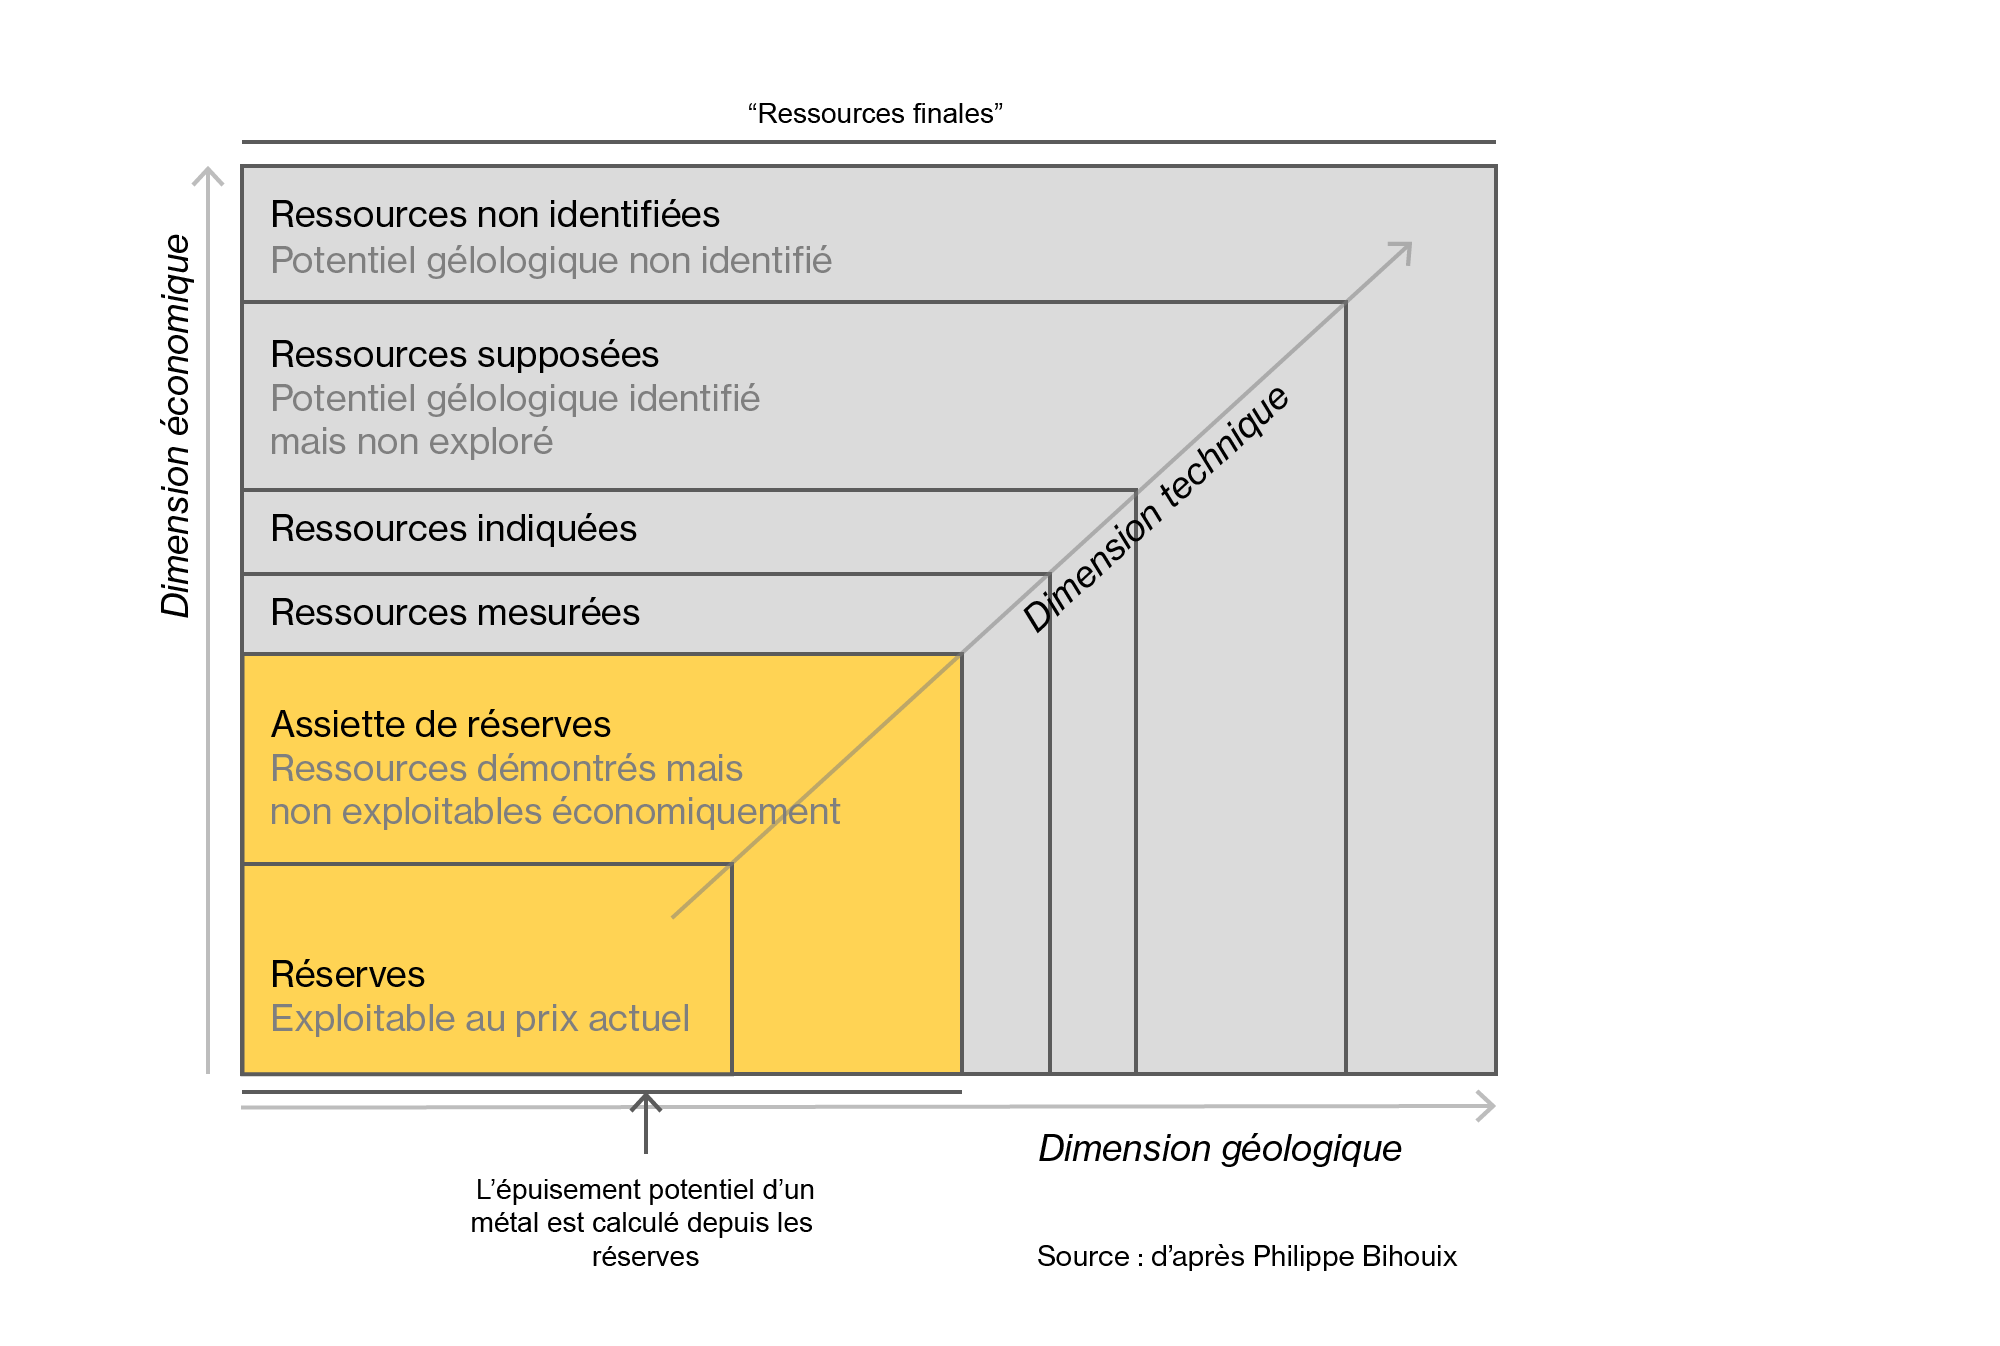
The definition of resources and reserves is therefore a complex exercise that depends on geological factors (location, concentration, quality, depth of the deposit), scientific and technological factors (state of knowledge of exploration, drilling, production, design of the necessary machinery), and economic factors (price on the raw material markets, cost of extraction, cost of the energy required for extraction, investment and operating costs). Other factors also come into play, such as the geopolitical factor: resources are not equally distributed in the earth’s crust, some countries have “richer” soils than others. There are also social and environmental factors: the opening of a mine and the cost of extraction also depend on the social standards (protection of personnel, salary policy, etc.) and environmental standards (pollution and depollution standards, water use, etc.) of the country where the operation is located. The criticality of a resource, rather than its depletion, is therefore relative to all these criteria.
Future demand
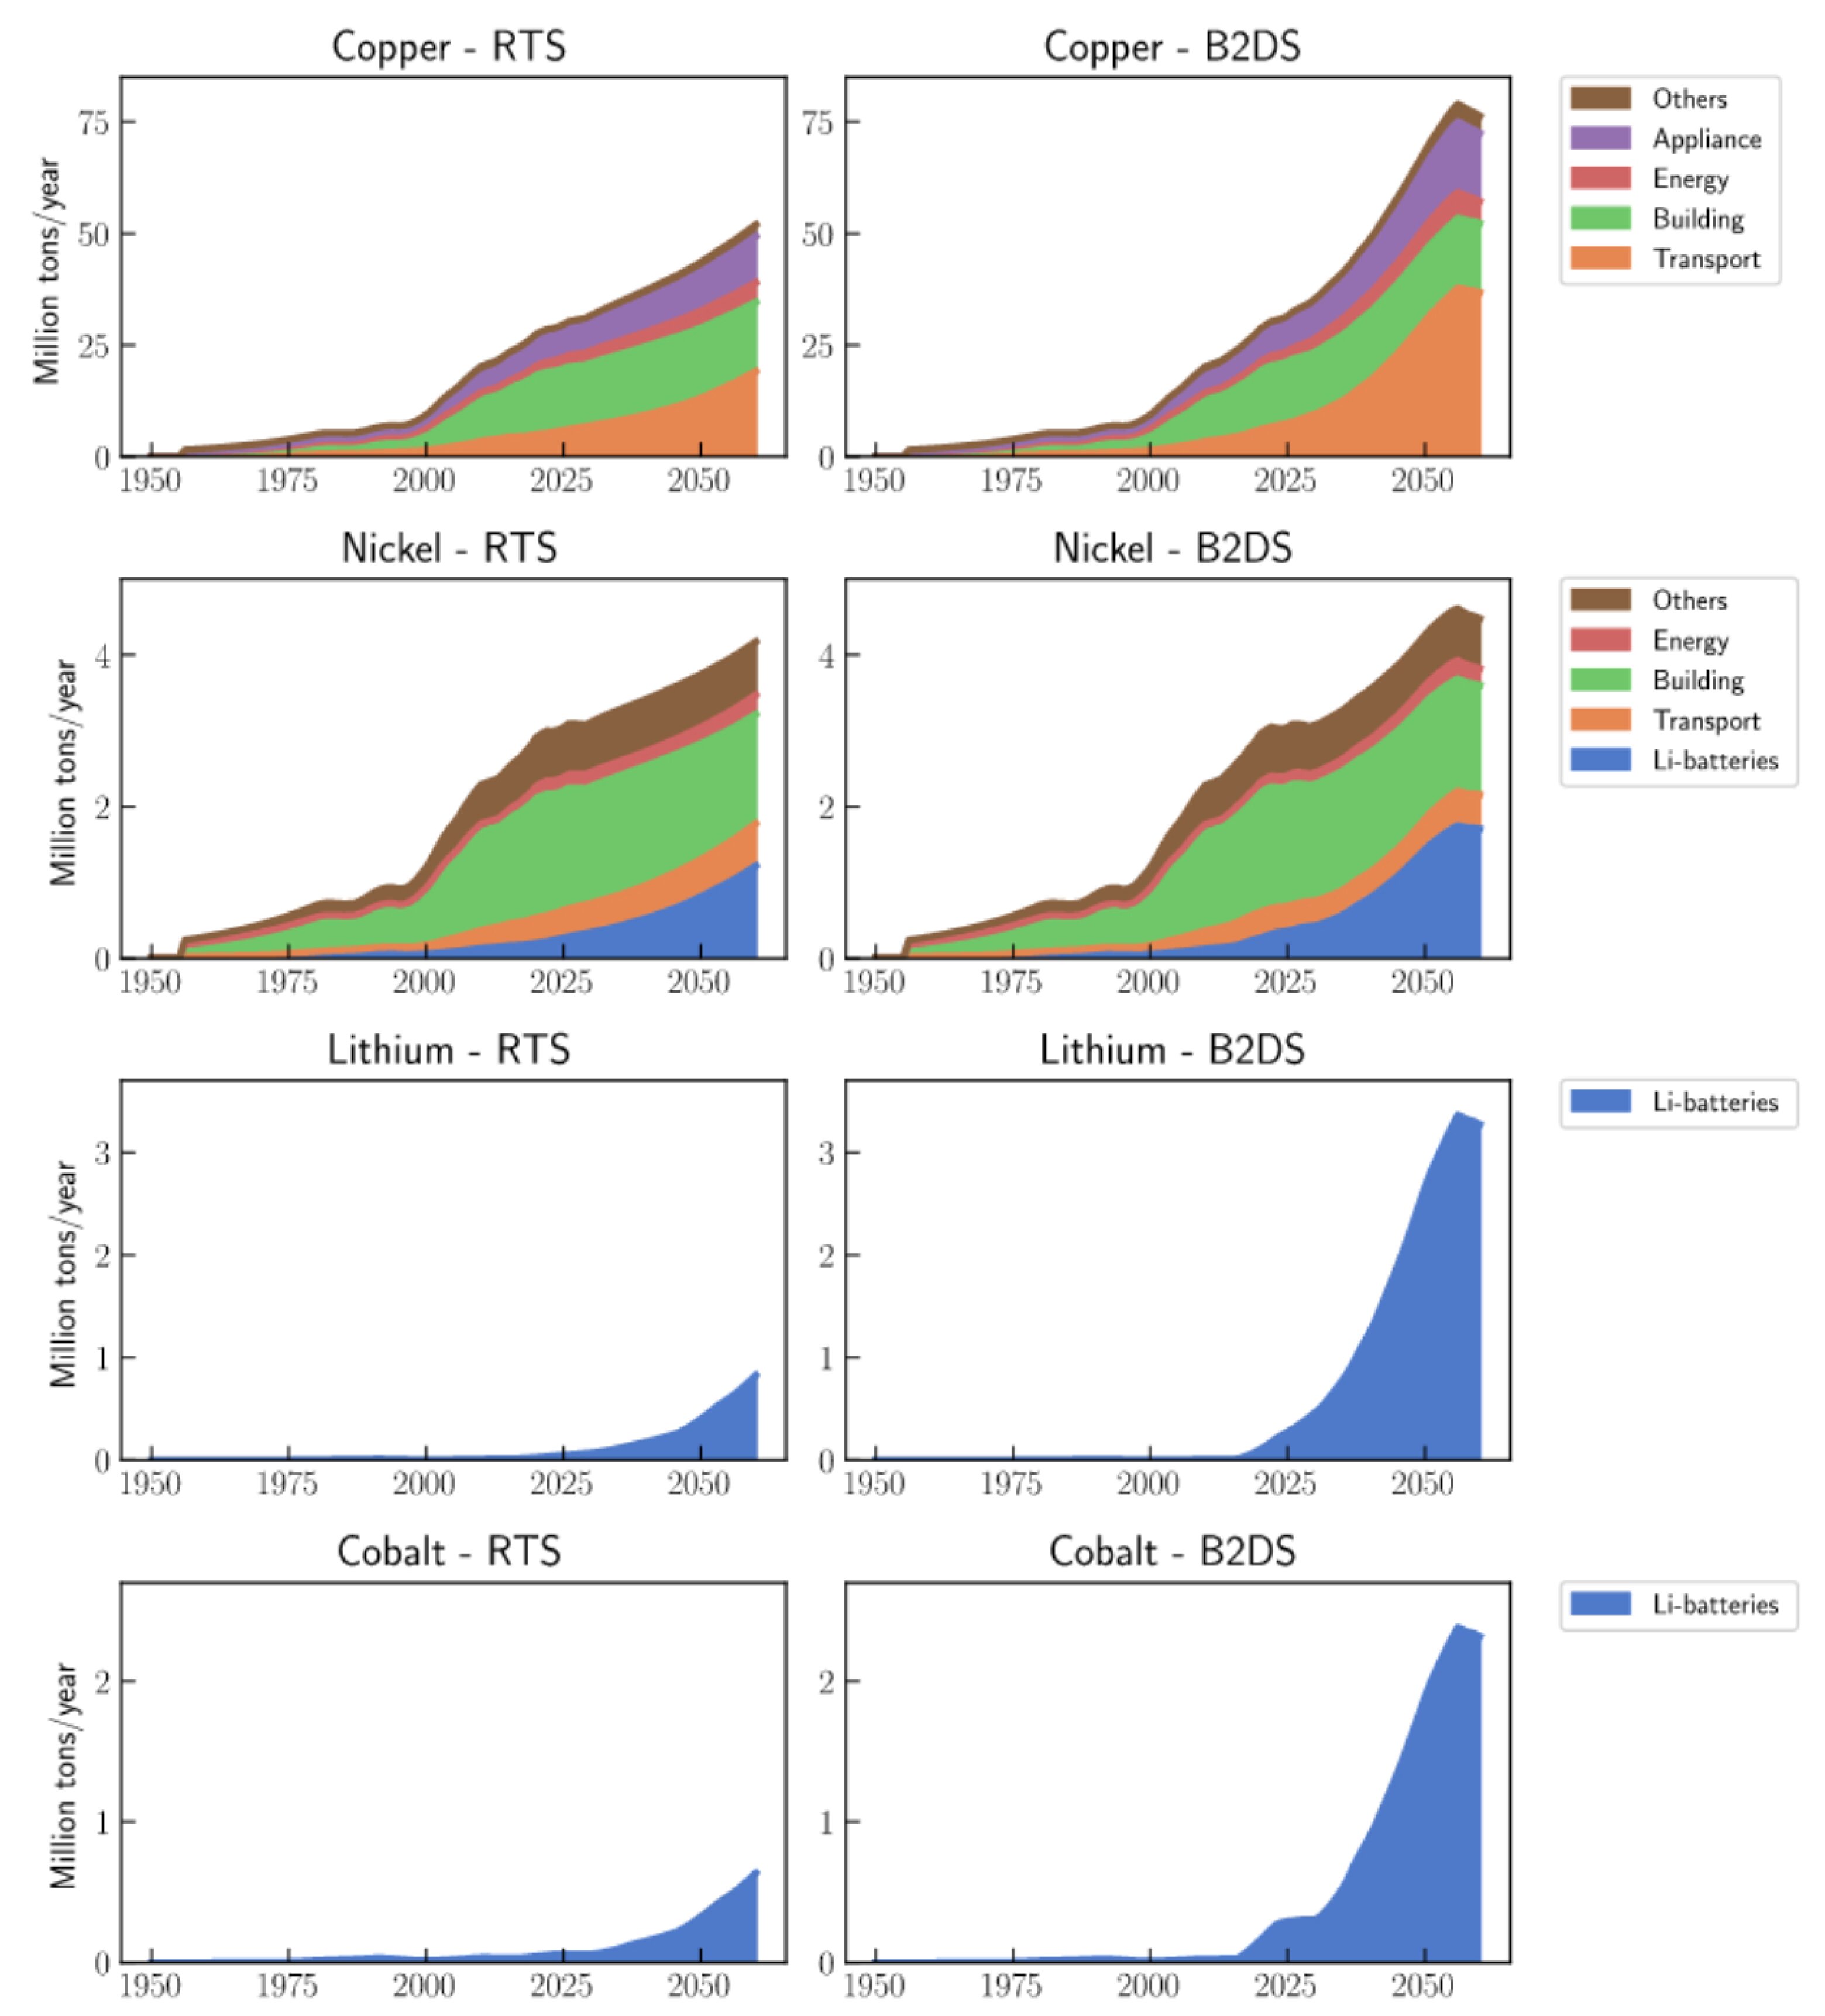
There is a general consensus that global mineral demand is going to increase very rapidly, especially with technologies related to the transition (electric vehicles, renewable energy). In a sustainable development scenario, the IEA estimates that we need to increase our mineral consumption by a factor of 4 between 2020 and 2040. At a time when the most abundant deposits are already being exploited and discoveries of new deposits are slowing down, it seems impossible to meet this demand.
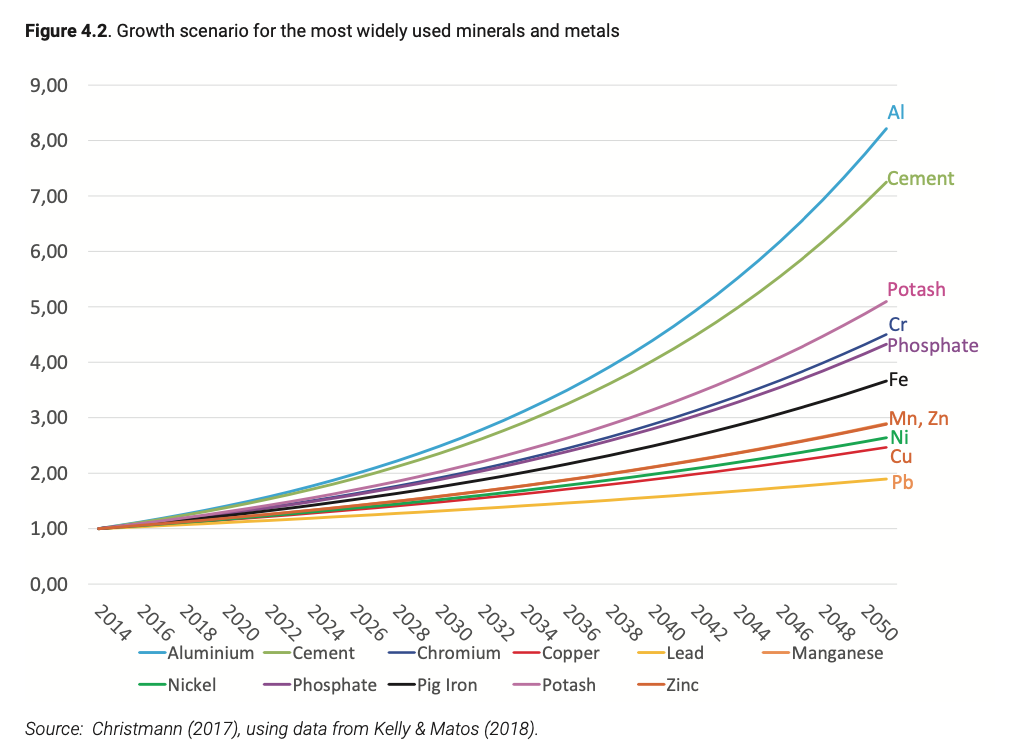
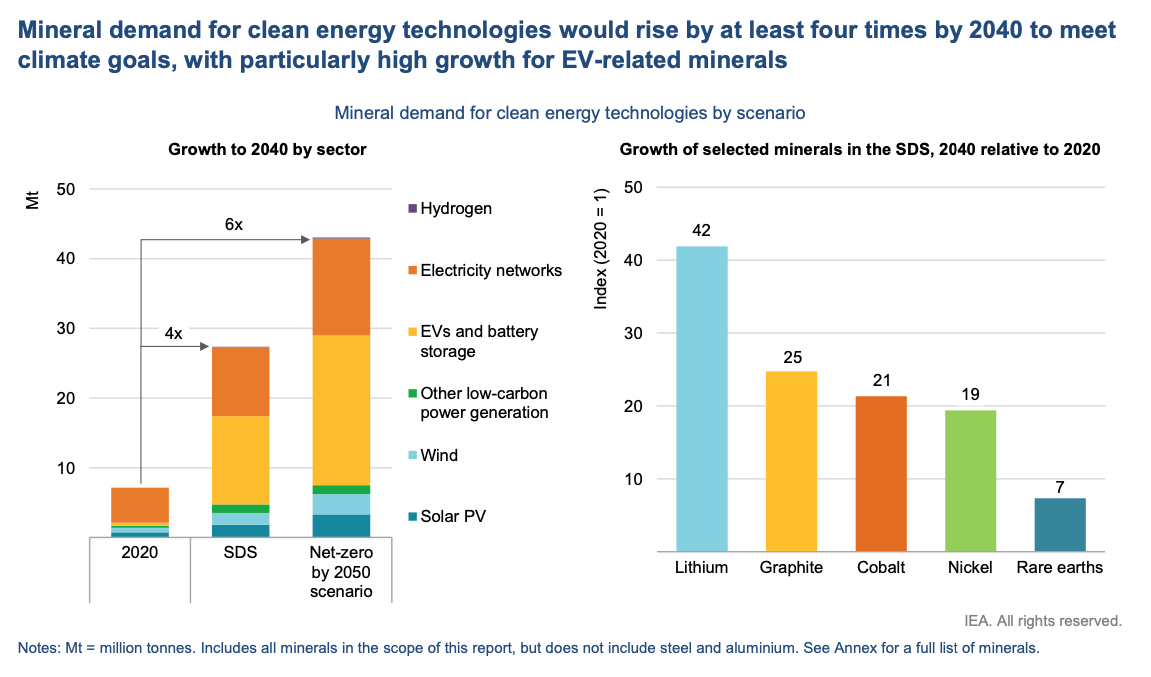
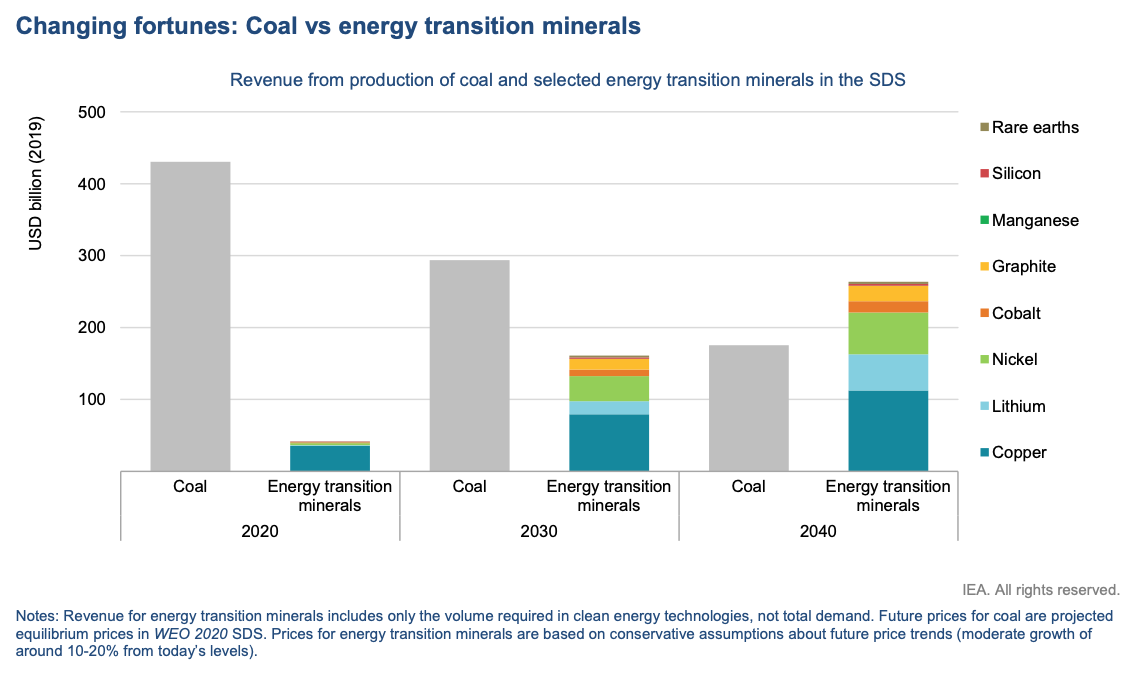
The energy transition relies on technologies and accelerated electrification that are very metal intensive. The production of batteries and electric vehicles represent a major part of this mineral demand. It seems unlikely that we will have to extract so much mineral at this scale and speed.
We could theoretically continue to push back the limits of known reserves and not experience metal depletion as long as we have an adequate technical knowledge, an attractive resource price, and sufficiently low exploitation costs (and therefore energy costs). Under these conditions, we could go and exploit deposits that are difficult to access, such as non-conventional deposits and deep-sea deposits. However, these conditions will be increasingly difficult to meet, despite an increase in demand, the best deposits have already been exploited and the yields of the deposits are falling. The engineer Philippe Bihouix describes the following vicious circle: ores are less and less concentrated, so more and more energy is needed to extract them, energy equipment uses more and more metals, so it is more and more difficult to produce energy and extract new metals. We can assume that we will have a criticality problem due to an energy problem, a water problem, a social problem and an environmental problem before we have a resource availability problem. It remains to be seen how long we will be able to pay this price and whether we really want to pay this price. Alain Geldron, national expert in raw materials believes that “the depletion of mineral resources before the end of this century is very unlikely for most mineral raw materials, but shortages over a long period of time are to be expected, if new deposits are not exploited quickly enough.”
[…] provides arguments for two classically opposed views of the future of mineral resources: an unaffordable increase in costs and prices following the depletion of high quality deposits or, on the contrary, a favourable compensation by technological improvements. Both visions are true, but not at the same time. After a period of gains in energy and production costs, it seems that we are now entering a pivotal period of long-term increasing production costs as we approach the practical minimum energy and thermodynamic limits for several metals. (Vidal et al., 2021)
Securing critical materiels in Europe
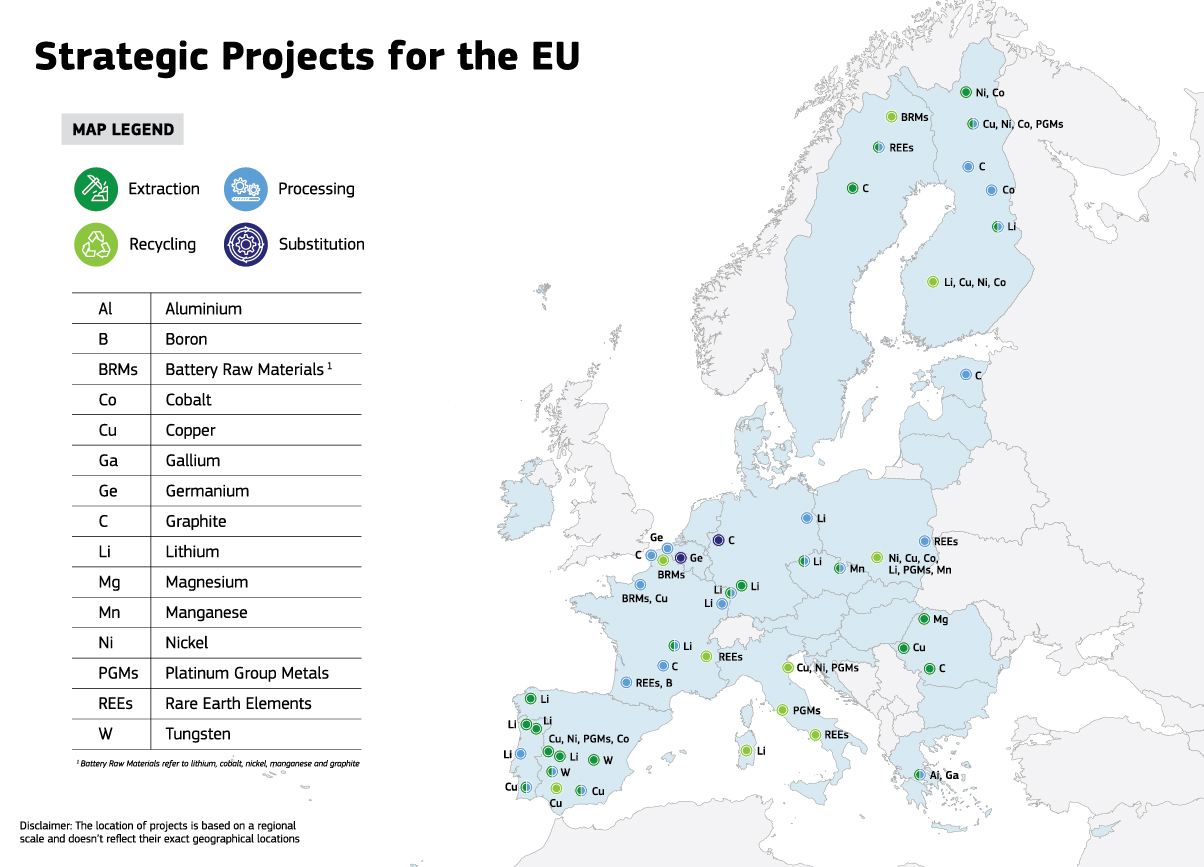
In an effort to increase its sovereignty and strategic autonomy, the European Union recently passed an act aimed at securing its access to critical and strategic metals : European Critical Raw Materials Act. Critical raw materials (CRMs) are defined as raw materials of primary importance to the European economy and are subject to supply chain risks such as dependence, economic risk, scarcity or weak substitutability.
Critical Raw Materials are indispensable for the EU economy and a wide set of necessary technologies for strategic sectors such as renewable energy, digital, aerospace and defence. The Critical Raw Materials Act (CRM Act) will ensure EU access to a secure and sustainable supply of critical raw materials, enabling Europe to meet its 2030 climate and digital objectives.
In a context of increased geopolitical tension and a turn towards protectionism this policy stems from Europe’s realisation of its dependencies in particular to China with regard to critical raw materials, many of which are essential for the digital sector, such as gallium, germanium, LREEs or HREEs. It is also driven by an increase in demand from strategic sectors, such as the ecological and digital transitions, as well as increased defence needs.

The EU’s Critical Raw Materials Act aims to increase the proportion of metals extracted within the EU to more than 10% of its consumption by 2030, as well as increasing the proportion of processing and recycling within the EU to more than 40% and 25% respectively, while reducing dependence on a single third country to less than 65% of the EU’s annual consumption.
Although the Critical Raw Materials Act highlights digital technology, the criticality issues for this sector are, in fact, minor compared to those for other strategic sectors. This is because the quantities used in each device and by the sector as a whole are limited, particularly in the case of the most critical metals. Therefore, an increase in the price of a material would only have a limited effect on the overall price of a devices. Apart from a few specific cases, supply risks in the digital technology sector appear to be more limited than in other strategic sectors.

Social and environmental conflicts
Discovering more deposits and exploiting them is not without consequences. The mining industry is one of the most polluting on Earth due to the use of toxic products, and its massive consumption of energy and water, which also ravages biodiversity and human health. Contrary to what the industry claims, there is no such thing as a clean or green mine. From an environmental point of view, the only thing to do is to limit the number of mines and to make the extraction conditions less dirty.
The opening of a mining site is very often a source of conflict. First, there is the issue of land use and land transformation. If the deposit is located in an inhabited area or in an area of high biodiversity, the project is likely to be conflictual. Second, there is the issue of resources needed to operate the mine. For example, large quantities of water are needed for the lithium salars in Chile and create conflicts over water use with local populations. Third, there is the question of pollution linked to the mine: air pollution, water pollution, toxicity for humans, wildlife, voluntary discharges, etc… Thus, the mining sector faces many legitimate challenges from local populations. Unfortunately, this sector has the highest number of killings of environmental activists according to Scheidel et al.
The huge expected increase in mineral resources consumption and primary production will increase conflicts and social opposition. The surface occupied by mines and quarries at the world level has been estimated to be about 400,000 km2 ; it could be doubled by 2050 and quadrupled by 2100. The embodied water consumption and other environmental impacts are expected to follow the same trends. (Vidal et al., 2021)
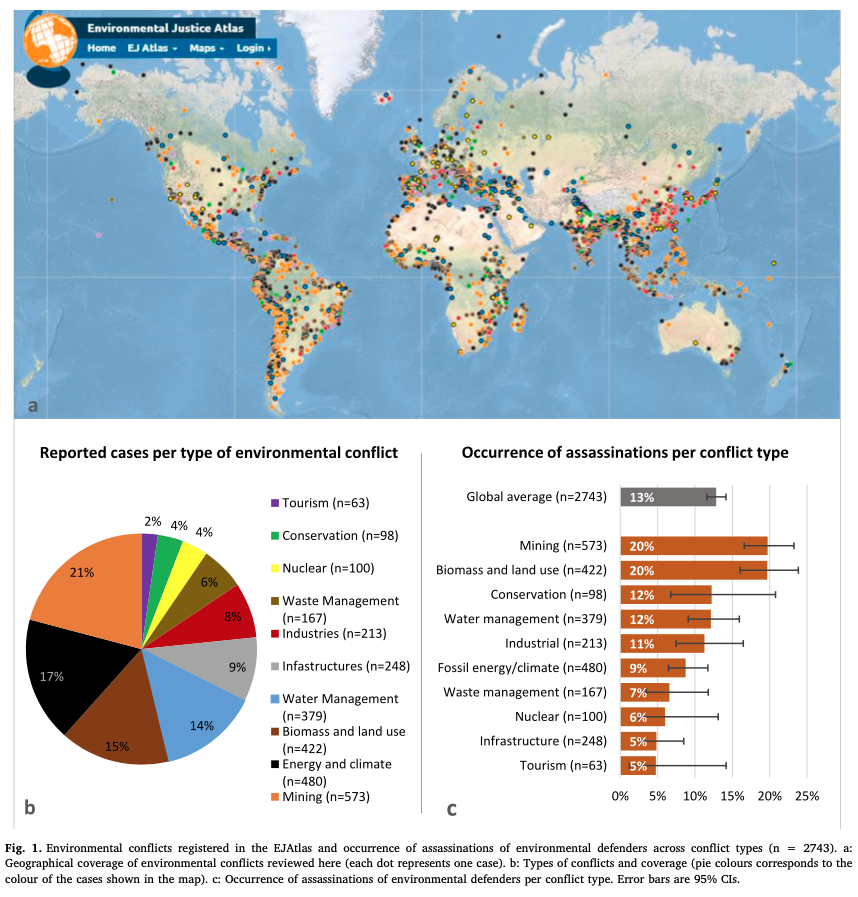
Moreover, the countries that consume the most mineral resources are generally not those that extract them. This means that pollution, water conflicts and other social and health consequences are not suffered by those who consume the end products. Thus the environmental consequences of the phenomenal increase in mineral demand will be less felt by post-industrial countries. The increase in mineral demand will result in the opening of new mining operations where social unrest may increasingly intensify due to the well known polliutions associated with the mining industry. Potentially, this will reinforce the “need” for more authoritarian regimes to quell local protests in order for mining to expand.
The issue of resources thus goes well beyond environmental issues and brings us directly back to the social, health and political issues related to this sector. A priori, we will not be able to meet the mineral demand envisaged in the future without making the conditions of exploitation more and more unbearable.
The European Commission presents the issue of relocating extraction and processing activities to Europe as both a sovereignty and sustainability issue. Indeed, the environmental standards in Europe could limit certain impacts. However, the mining industry is inherently a source of environmental damage. Furthermore, in a context of rising metal consumption, the relocation of mines would, in reality, be more of an addition than a substitution.
Material resources for ICT
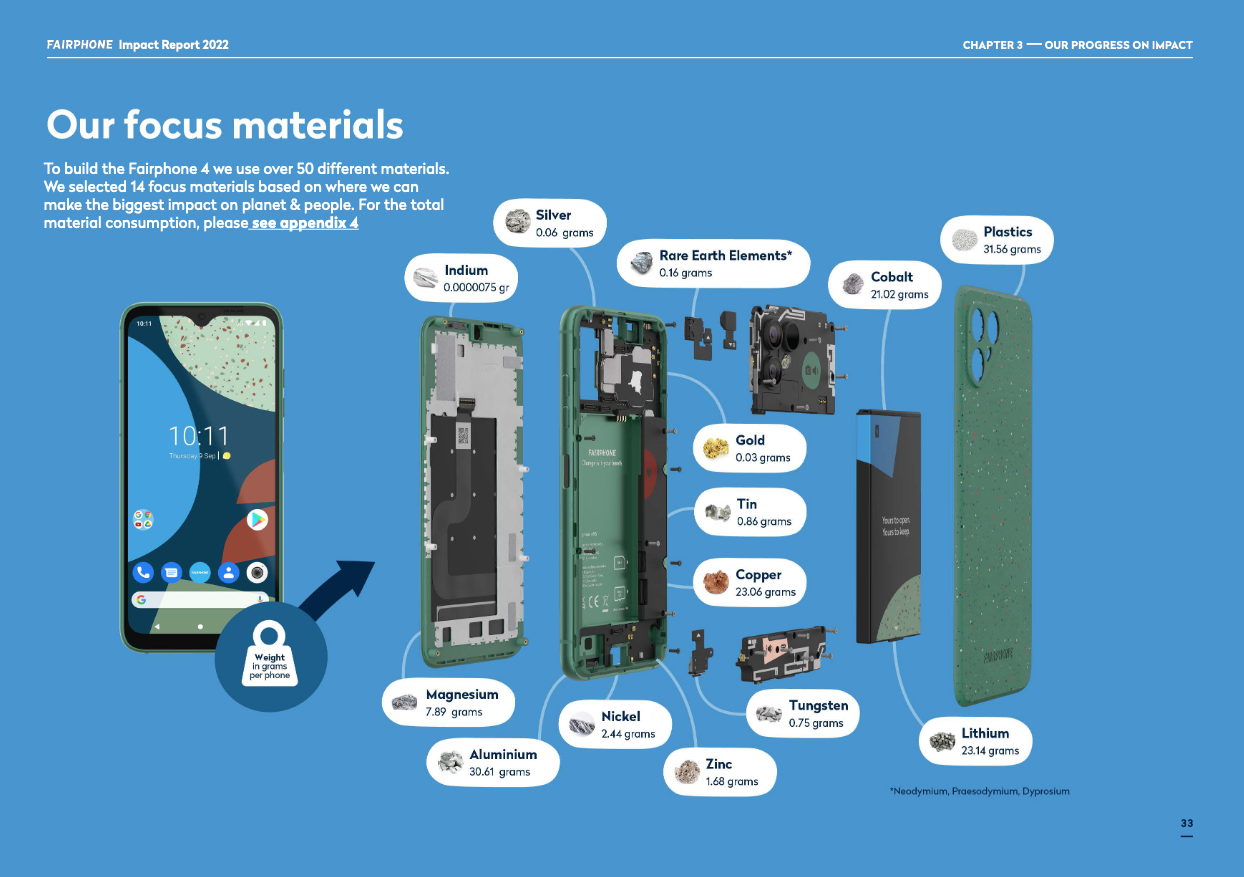
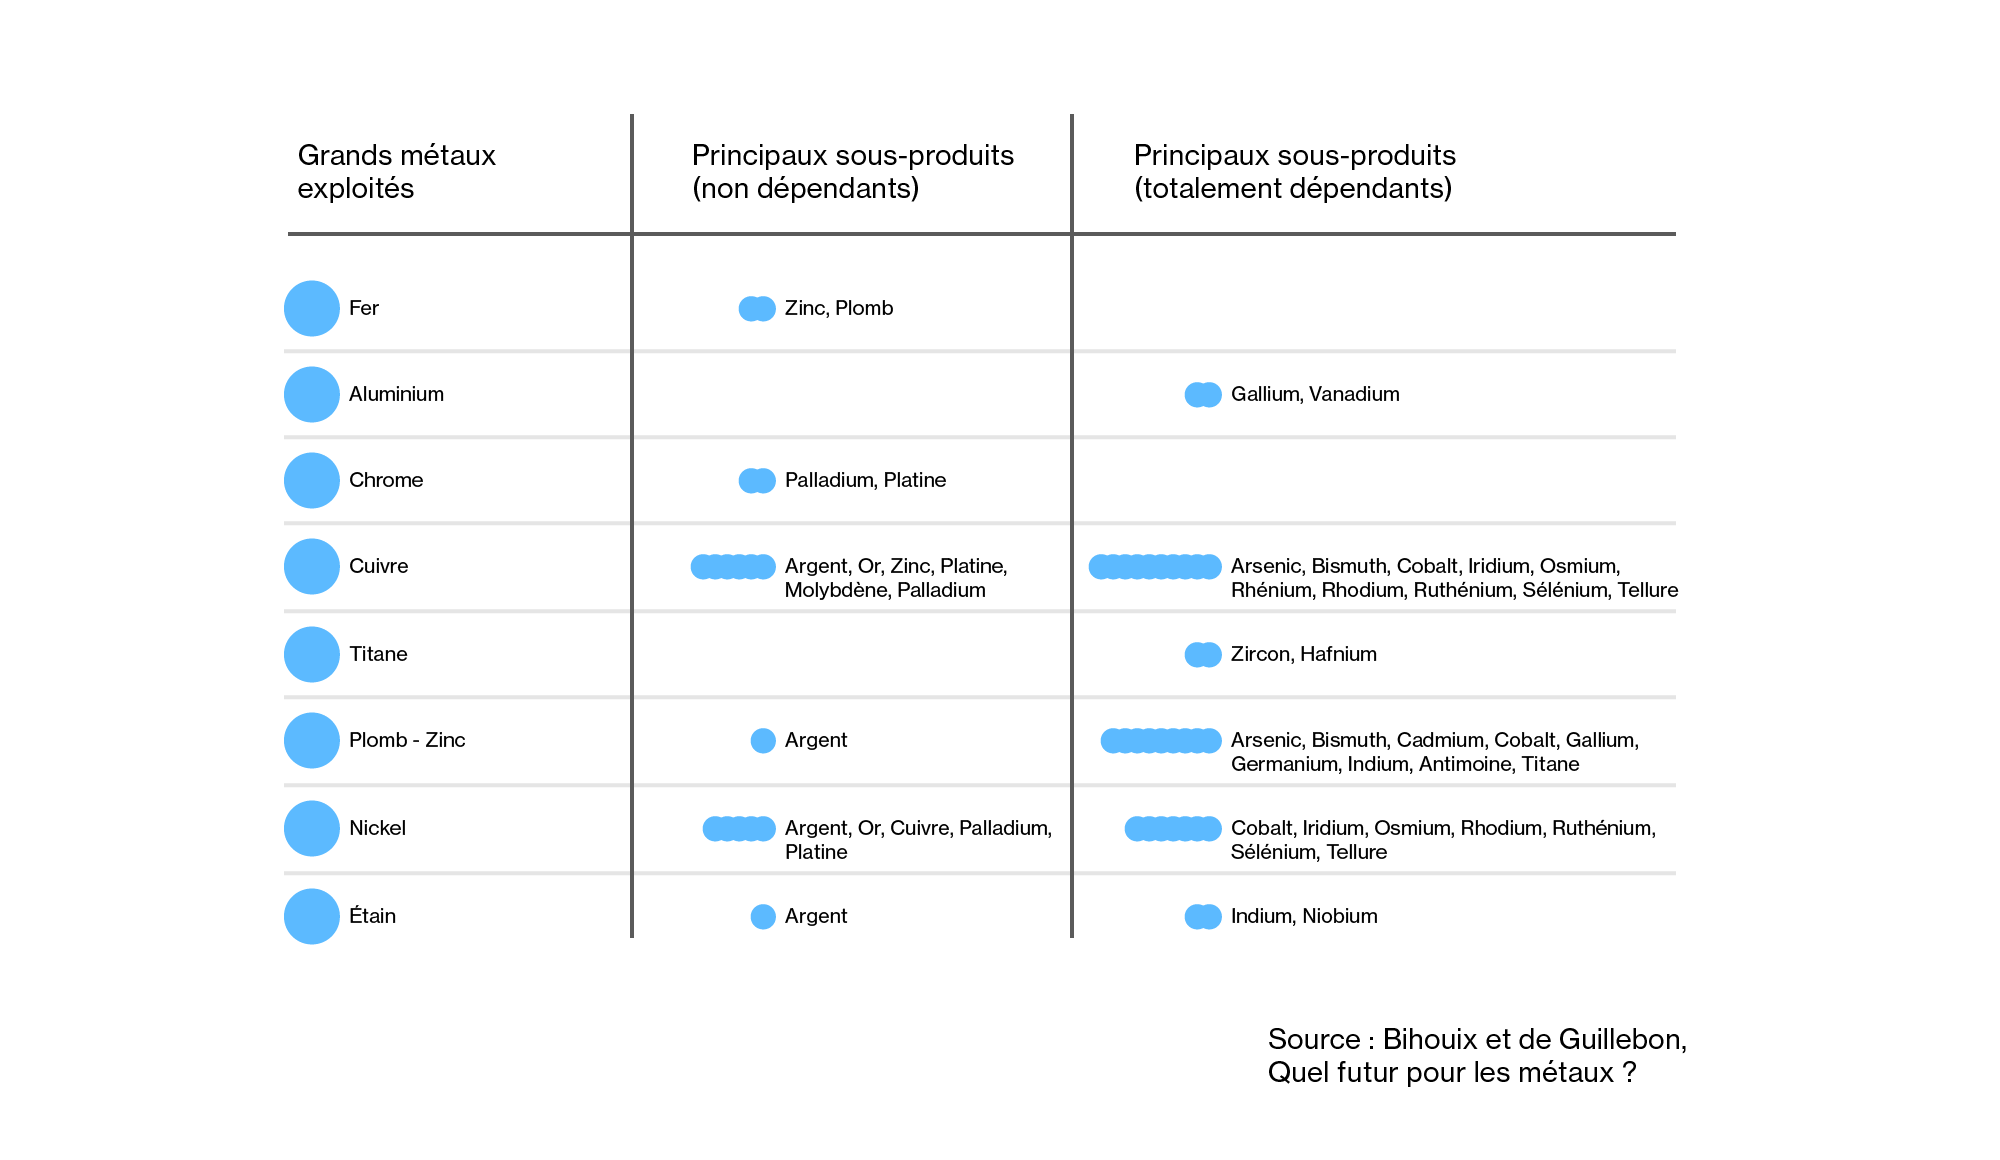
In the digital sector there are two categories of metals, those used in large quantities for their structural functions (telecommunication networks → copper, aluminum, some steels) and metals used in small quantities for their exceptional properties in the high-tech industry (small metals and precious metals) . In total, the digital sector solicits more than 60 metals in very diverse volumes and more than half of these metals depend on the extraction of other metals. Indeed, some small metals demanded by the digital sector do not represent a sufficiently large volume of demand to justify the opening of a dedicated mine, so they are extracted in mines whose profitability depends on the massive extraction of large metals. For example, gallium depends on the extraction of aluminum bauxite and germanium is only recoverable from zinc ore. This interdependence can be problematic because it implies that an increase in demand for a small metal will not lead to an increase in supply because it would require an increase in production of the large metal on which the small metal depends. If the demand for germanium increases, then zinc production must be increased, and to justify this increase in production, it must be economically attractive, so the demand for zinc must increase. In short, the supply of small metals and precious metals will not always match the demand because of their co-dependence.
So what are the differences in production between large metals and small and precious metals? When it comes to large metals like copper, aluminum, iron or tin for example, their consumption is also increasing. According to the International Copper Study Group, the total consumption of copper in the world amounted to 24 million tons in 2017. The share of consumption related to the use of copper as an electrical conductor reached almost 60%, “that is, about 11 million tons for the generation, distribution and transmission of electricity, and 3 million tons for the subset of electrical and electronic equipment to which digital belongs,” as Liliane Dedryver reminds us for France Stratégie. The governemental think tank estimates “that one ton of copper is needed to produce 250,000 smartphones and tablets, the 1.4 billion new smartphones sold worldwide in 2017 (including 20 million in France) required the consumption of 5,600 tons of copper (including 80 tons for France).”

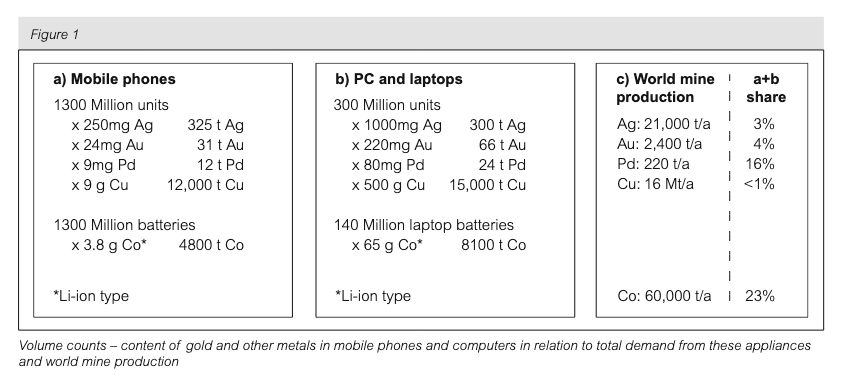
On the side of small metals the volumes mined are largely different. For example, the annual production of tantalum was estimated at 1,800 tons in 2017 and 2018 . At least half of the production of this metal was used for the manufacture of electronic capacitors. These capacitors have notably enabled the miniaturization of digital equipment. The manufacture of consumer electronics is driving the majority of the production of this metal and leads to an estimated annual growth rate of 5.8% . Other metals such as gallium and germanium are used for their properties in the manufacture of semiconductors. Their annual production is estimated at 320 and 106 tons respectively. Less than one gram of each of these metals is used in the manufacture of a smartphone. Although the volume produced is small, digital equipment accounts for the bulk of the demand. It is the same for Indium used in touch screens.
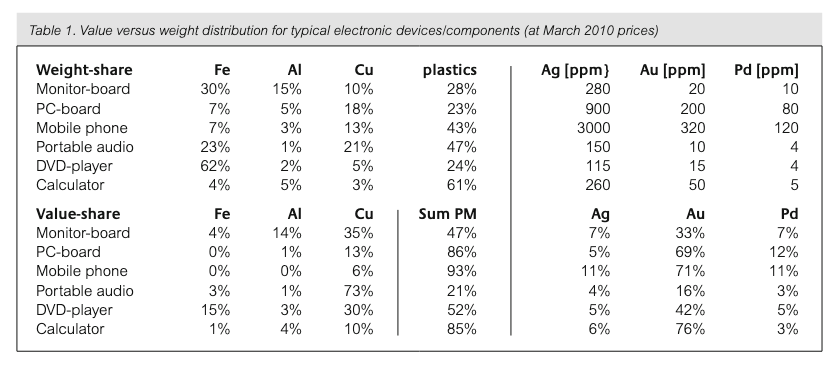
In the face of ever-increasing material consumption, recycling of e-waste is still not encouraged, both by the design of the equipment and by the level of investment required for a recycling center. The metals present in digital equipment are difficult to recover and recycle because they are present in too small quantities or because they are used in an alloy and cannot be separated. Recycling industries have to invest much more to recover metals than other industries: “Florian Fizaine cites the example of the company UMICORE: “One billion dollars has been invested in Umicore’s recycling and refining plant operating in Belgium. This plant extracts 30 tons of gold, 37 tons of platinum group metals, 1,000 tons of silver and 68,500 tons of other metals per year from scrap. This makes it the third largest gold mine in the world […] By comparison, a paper recycling plant only requires an investment of 30 to 50 million dollars” (France Stratégie). In the end, recycling is not a long-term solution and the crux of the problem is the increase in consumption which leads to an increase in extraction, whether we have an efficient recycling chain or not. A constant growth of the couple production/consumption will inevitably be linked to an increase of pollution in water, air and soils affecting the ecosystems and communities where the extraction and waste disposal activities are located.
Towards a scarcer world
The increase in demand for resources, particularly minerals, compared to the current state of the mining sector indicates that shortages are coming in several metals. If mining projects accelerate then environmental, social and health damage will increase together. Digital technologies increase the pressure on small and rare metals while including them in products that are not designed for resource recovery. Recovery of small and rare matelas through recycling is now extremely limited except for a few high-value metals like gold and platinum. We’ve just touched on the mineral resource issues here, but the material foundation of digital technology is made up of a large number of critical resources.
It would be naive to think about the future of digital technologies without taking into account the question of resources, particularly mineral resources. The future of the digital sector will be shaped by cyclical shortages of several metals and the resulting shockwaves in production chains. While the digital sector has historically been built on an abundant material base, this base is rapidly being eroded. Maintaining the current trajectory of development of the digital sector implies amplifying the social and environmental disasters linked to the mining sector. Under these conditions, there will be no clean or fair digital transition. One should even ask whether it is desirable.
Resources
Syllabus
- Dillon Marsh, For What It’s Worth, 2018
- Judith Pigneur, The Potential for Responsible Sourcing in the Magnet Value Chain: Strategies for the Future, 2020
- IEA, The Role of Critical Minerals in Clean Energy Transitions, 2021
To go further
- Olivier Vidal et al., Modelling the Demand and Access of Mineral Resources in a Changing World, 2021
- US Geological Survey, Mineral Commodity Summaries 2023
- Florian Fizaine, The economics of recycling rate: New insights from waste electrical and electronic equipment, 2020
- Liliane Dedryver, La consommation de métaux du numérique : un secteur loin d’être dématérialisé, 2020 [FR]
- Arnim Scheidel et al., Environmental conflicts and defenders: A global overview, 2020
- SystEx, Controverses minières - Pour en finir avec certaines contrevérités sur la mine et les filières minérales - Volet 1, 2021 [FR]
Session 6 : Processing and purifying
The limitations of analysing the impacts of digital technology through the lens of mining
The increase in demand for resources, particularly minerals, compared to the current state of the mining sector indicates that shortages are coming in several metals. If mining projects accelerate then environmental, social and health damage will increase together.
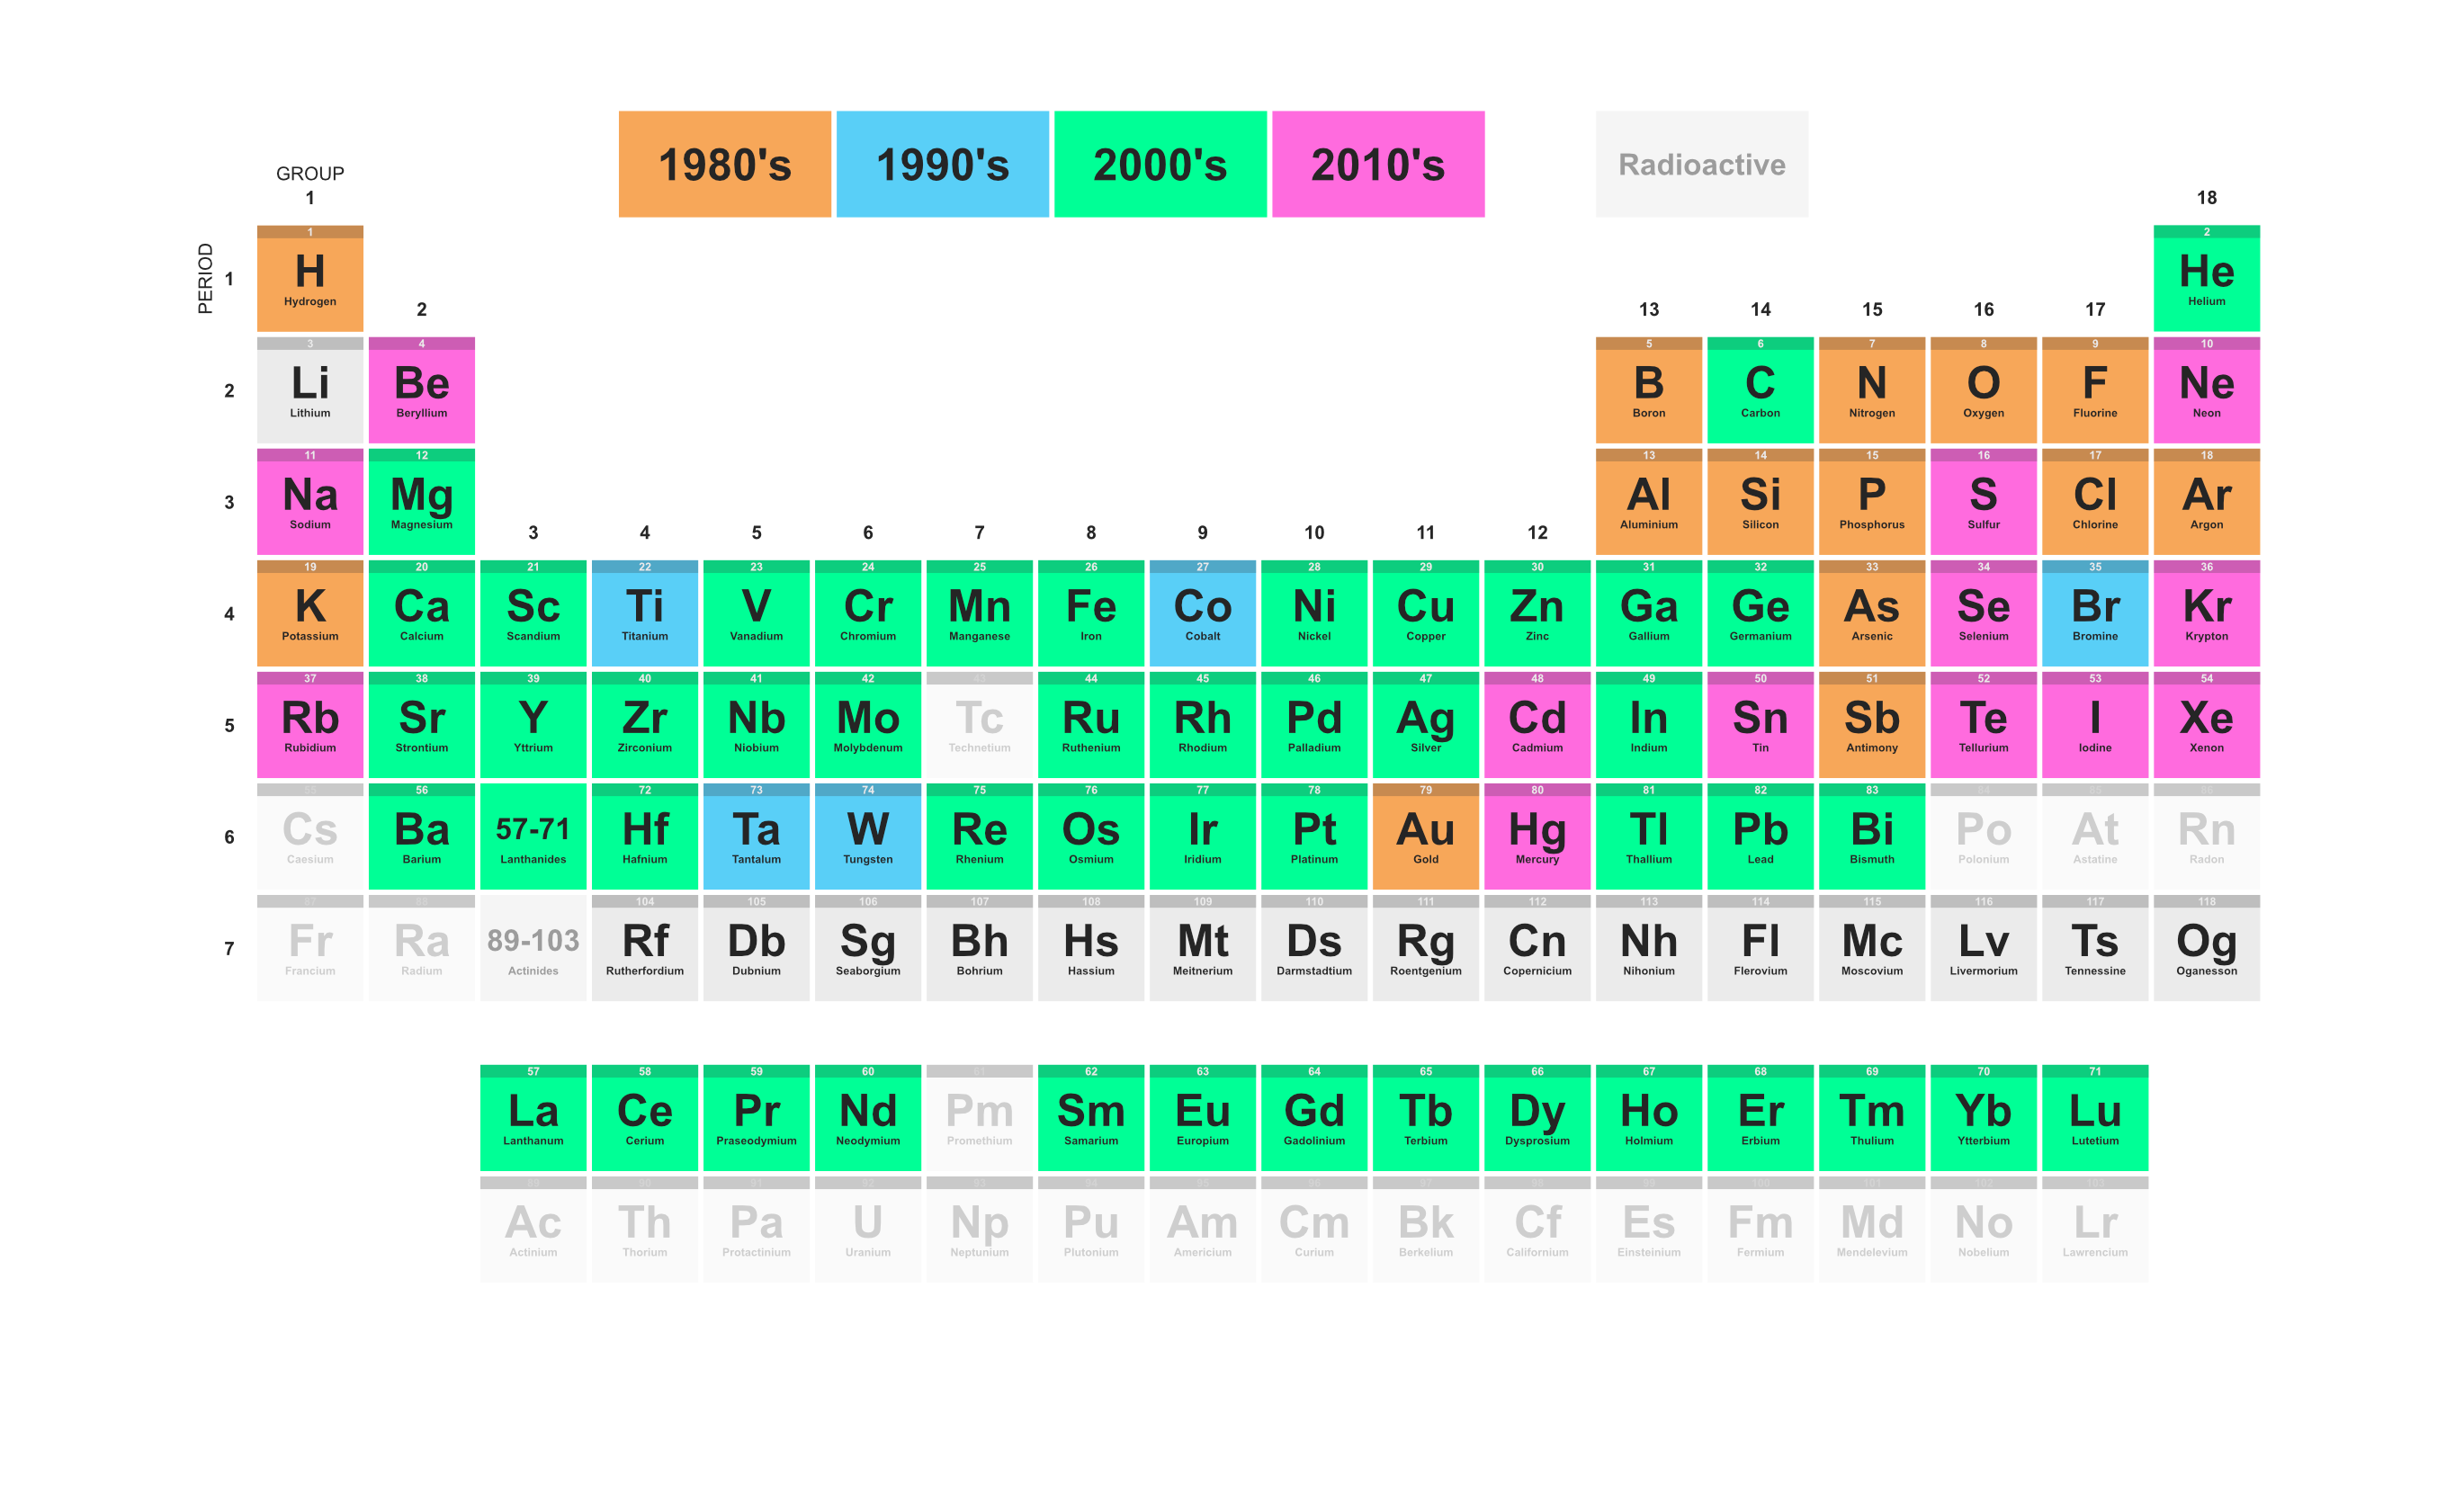
The digital sector does not appear to be the main driver behind the opening of new mines or the sector primarily facing shortages. Most of the metals it relies on are used in small quantities and it is rarely their main consumer. Furthermore, the metals most widely used by digital technologies often are co-depend on other large metals, meaning their supply is not solely determined by the needs of the digital sector. Nevertheless, maintaining the current rate of digital expansion continues to fuel extractivist practices, thereby exacerbating the social and environmental issues associated with mining. Under these conditions, a genuinely clean or fair digital transition is impossible.
In order to understand the main environmental challenges facing the digital sector, it is insufficient to consider them throught the lens of the mining industry alone. To do so, we must look further down the value chain to understand the specific characteristics of the sector in terms of socio-environmental impacts.
Purer than pure
This section uses the research paper from Gauthier Roussilhe, Thibault Pirson, David Bol, Srinjoy Mitra, titled: Purer than pure: how purity reshapes the upstream materiality of the semiconductor industry. (Link to preprint).
We have already seen the huge variety of materials involved in the digital value chain. We also examined the challenges associated with extracting these resources. However, the volume of material extracted for digital applications is limited compared to global extraction rates. Recently, a new approach has emerged that considers the specificities of the upstream semiconductor value chain, which is often not located at the extraction site, but at the stage of raw material purification.
The most recent data from the United Nations show that the value of key elements used for the Information and Communication (ICT) technologies such as gallium (Ga), germanium (Ge), indium (In), rare earth elements (REEs), selenium (Se), tantalum (Ta) and tellurium (Te), only accounted for 0.77% of all elements mined in 2018 (excluding coal) [7]. Although it is undeniable that ICT goods and services would not exist without the production of the mining industry, its mineral demand seems at first sight limited. To have a more comprehensive picture of the materiality of the digital sector, a complementary perspective further exploring production chains is needed. […] Microchips are arguably the most complex artefacts human beings have ever made, and the ones that require not only the largest variety of elementary material, but also with ultra-high purity requirements.
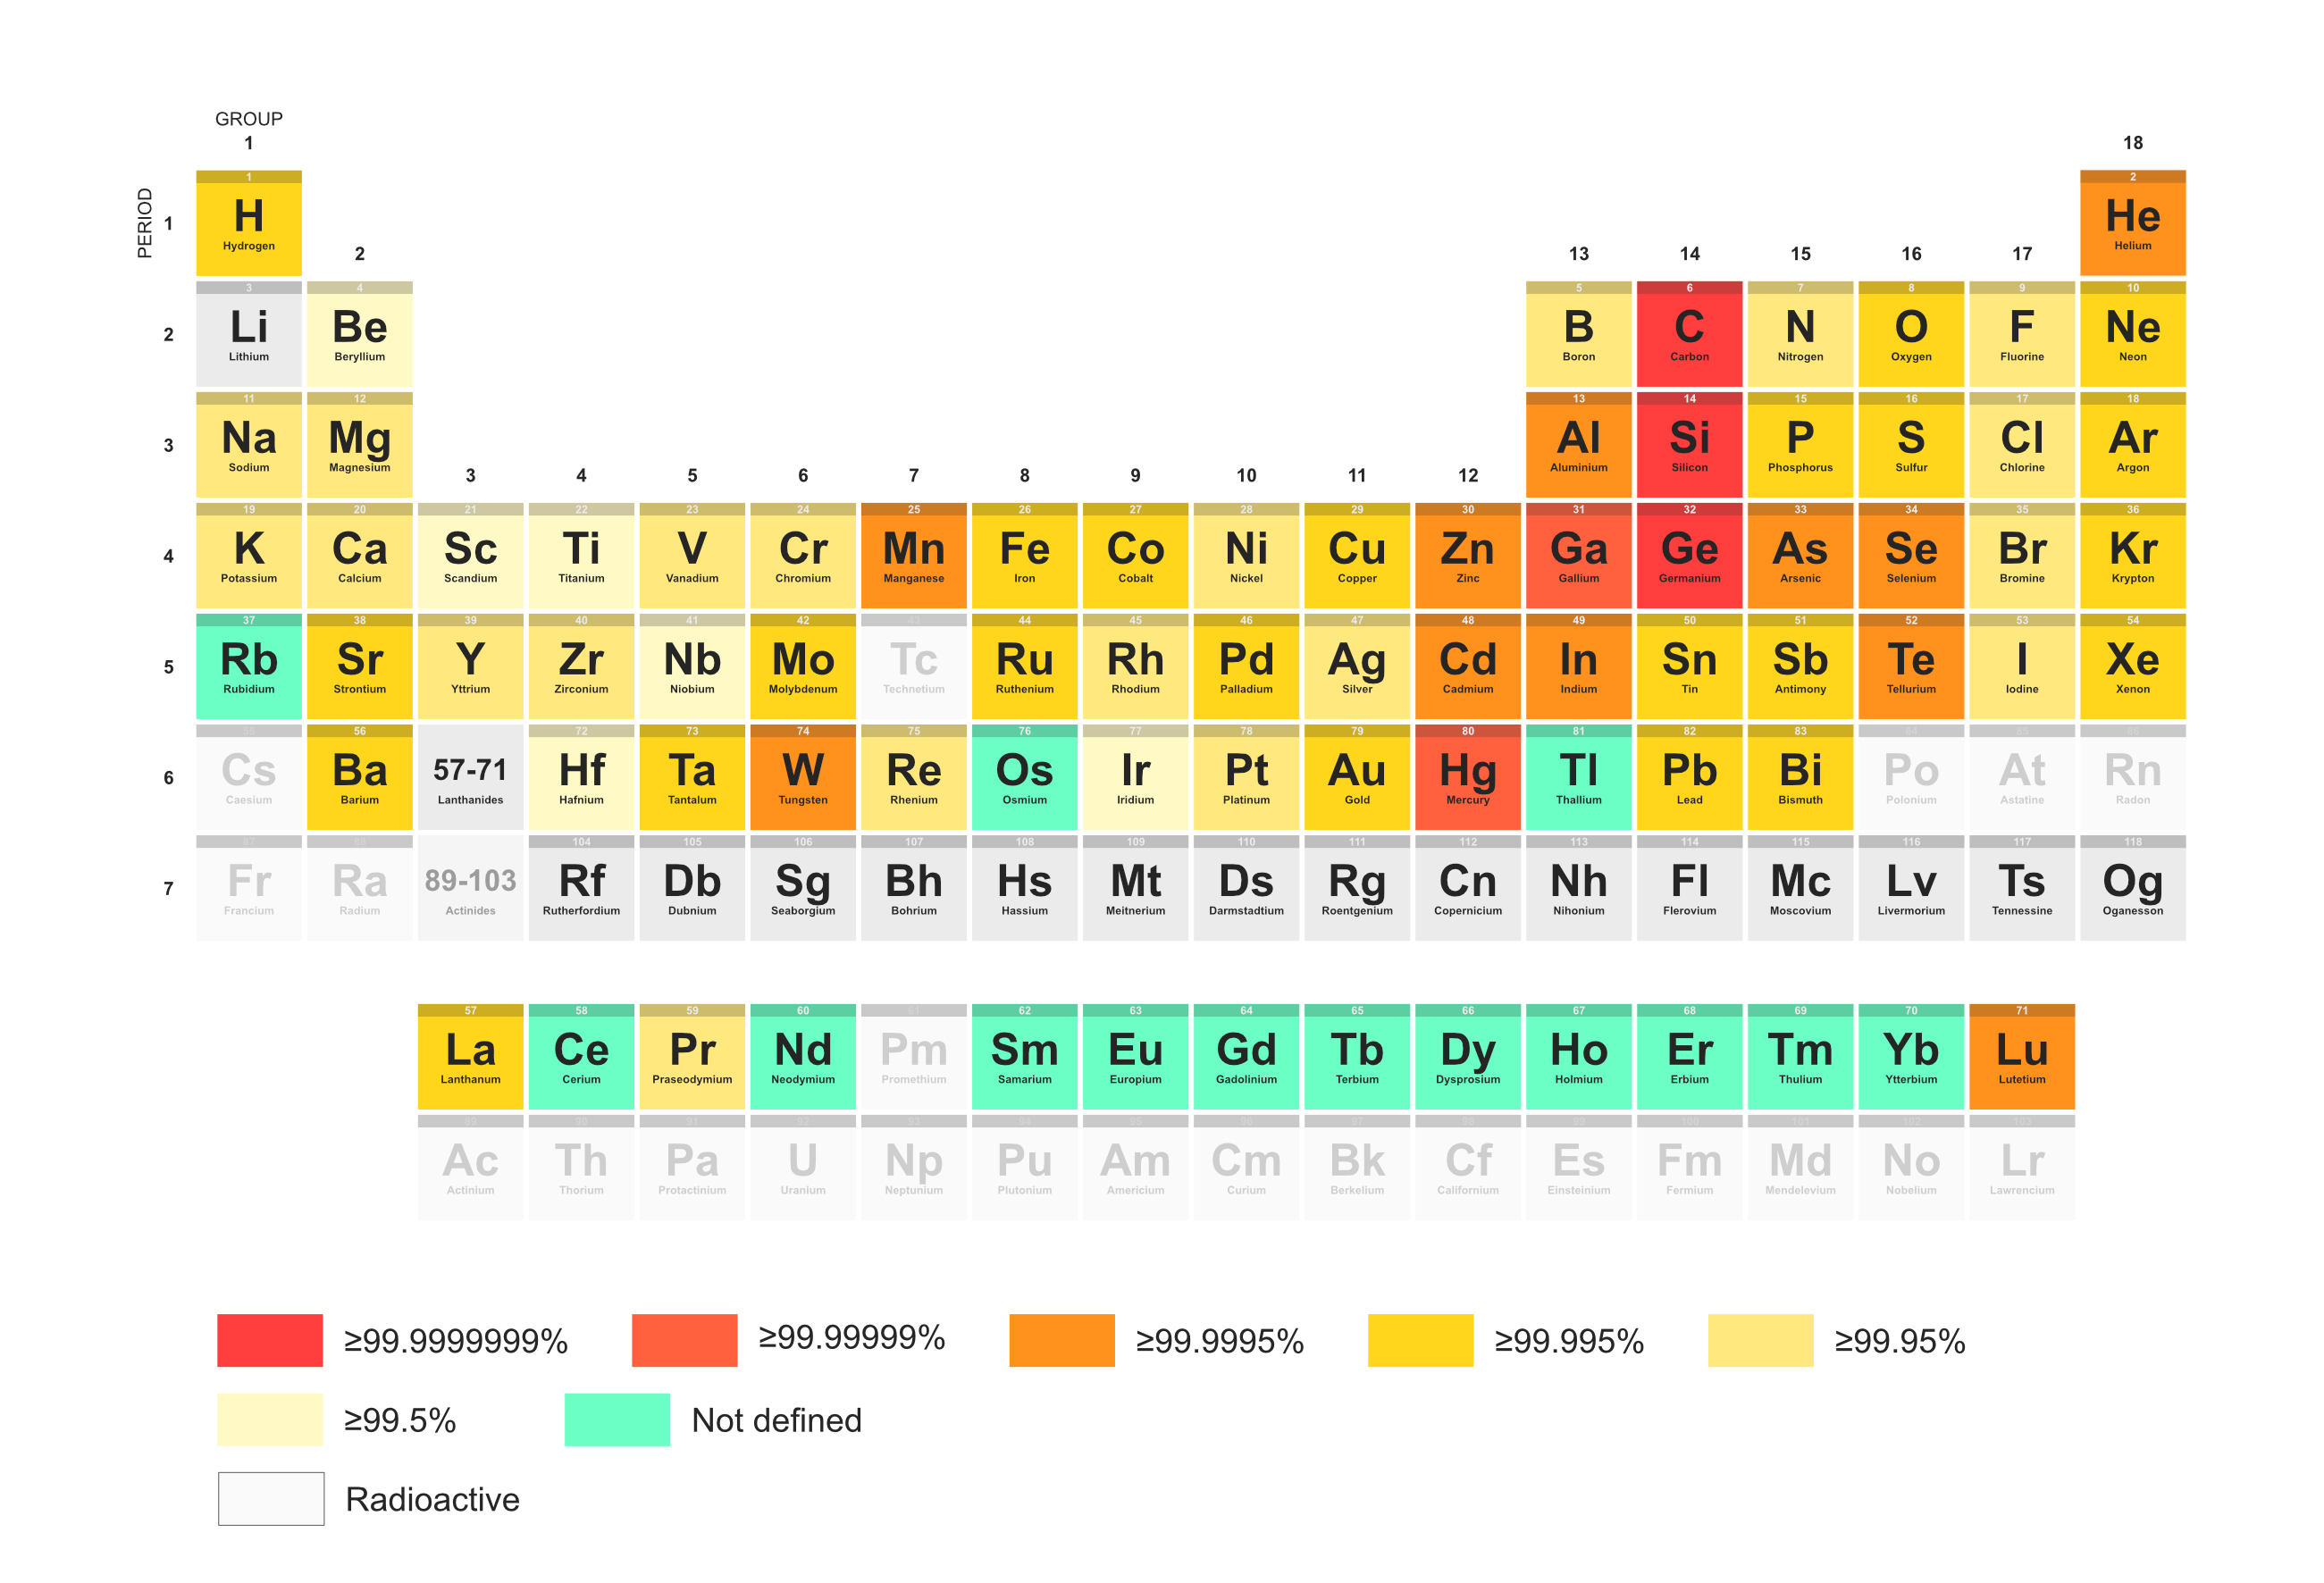
Non-exhaustive summary of the main elements used in the semiconductor industry (upstream). Purity requirements for the element are indicated by shades of orange
The case of silicon
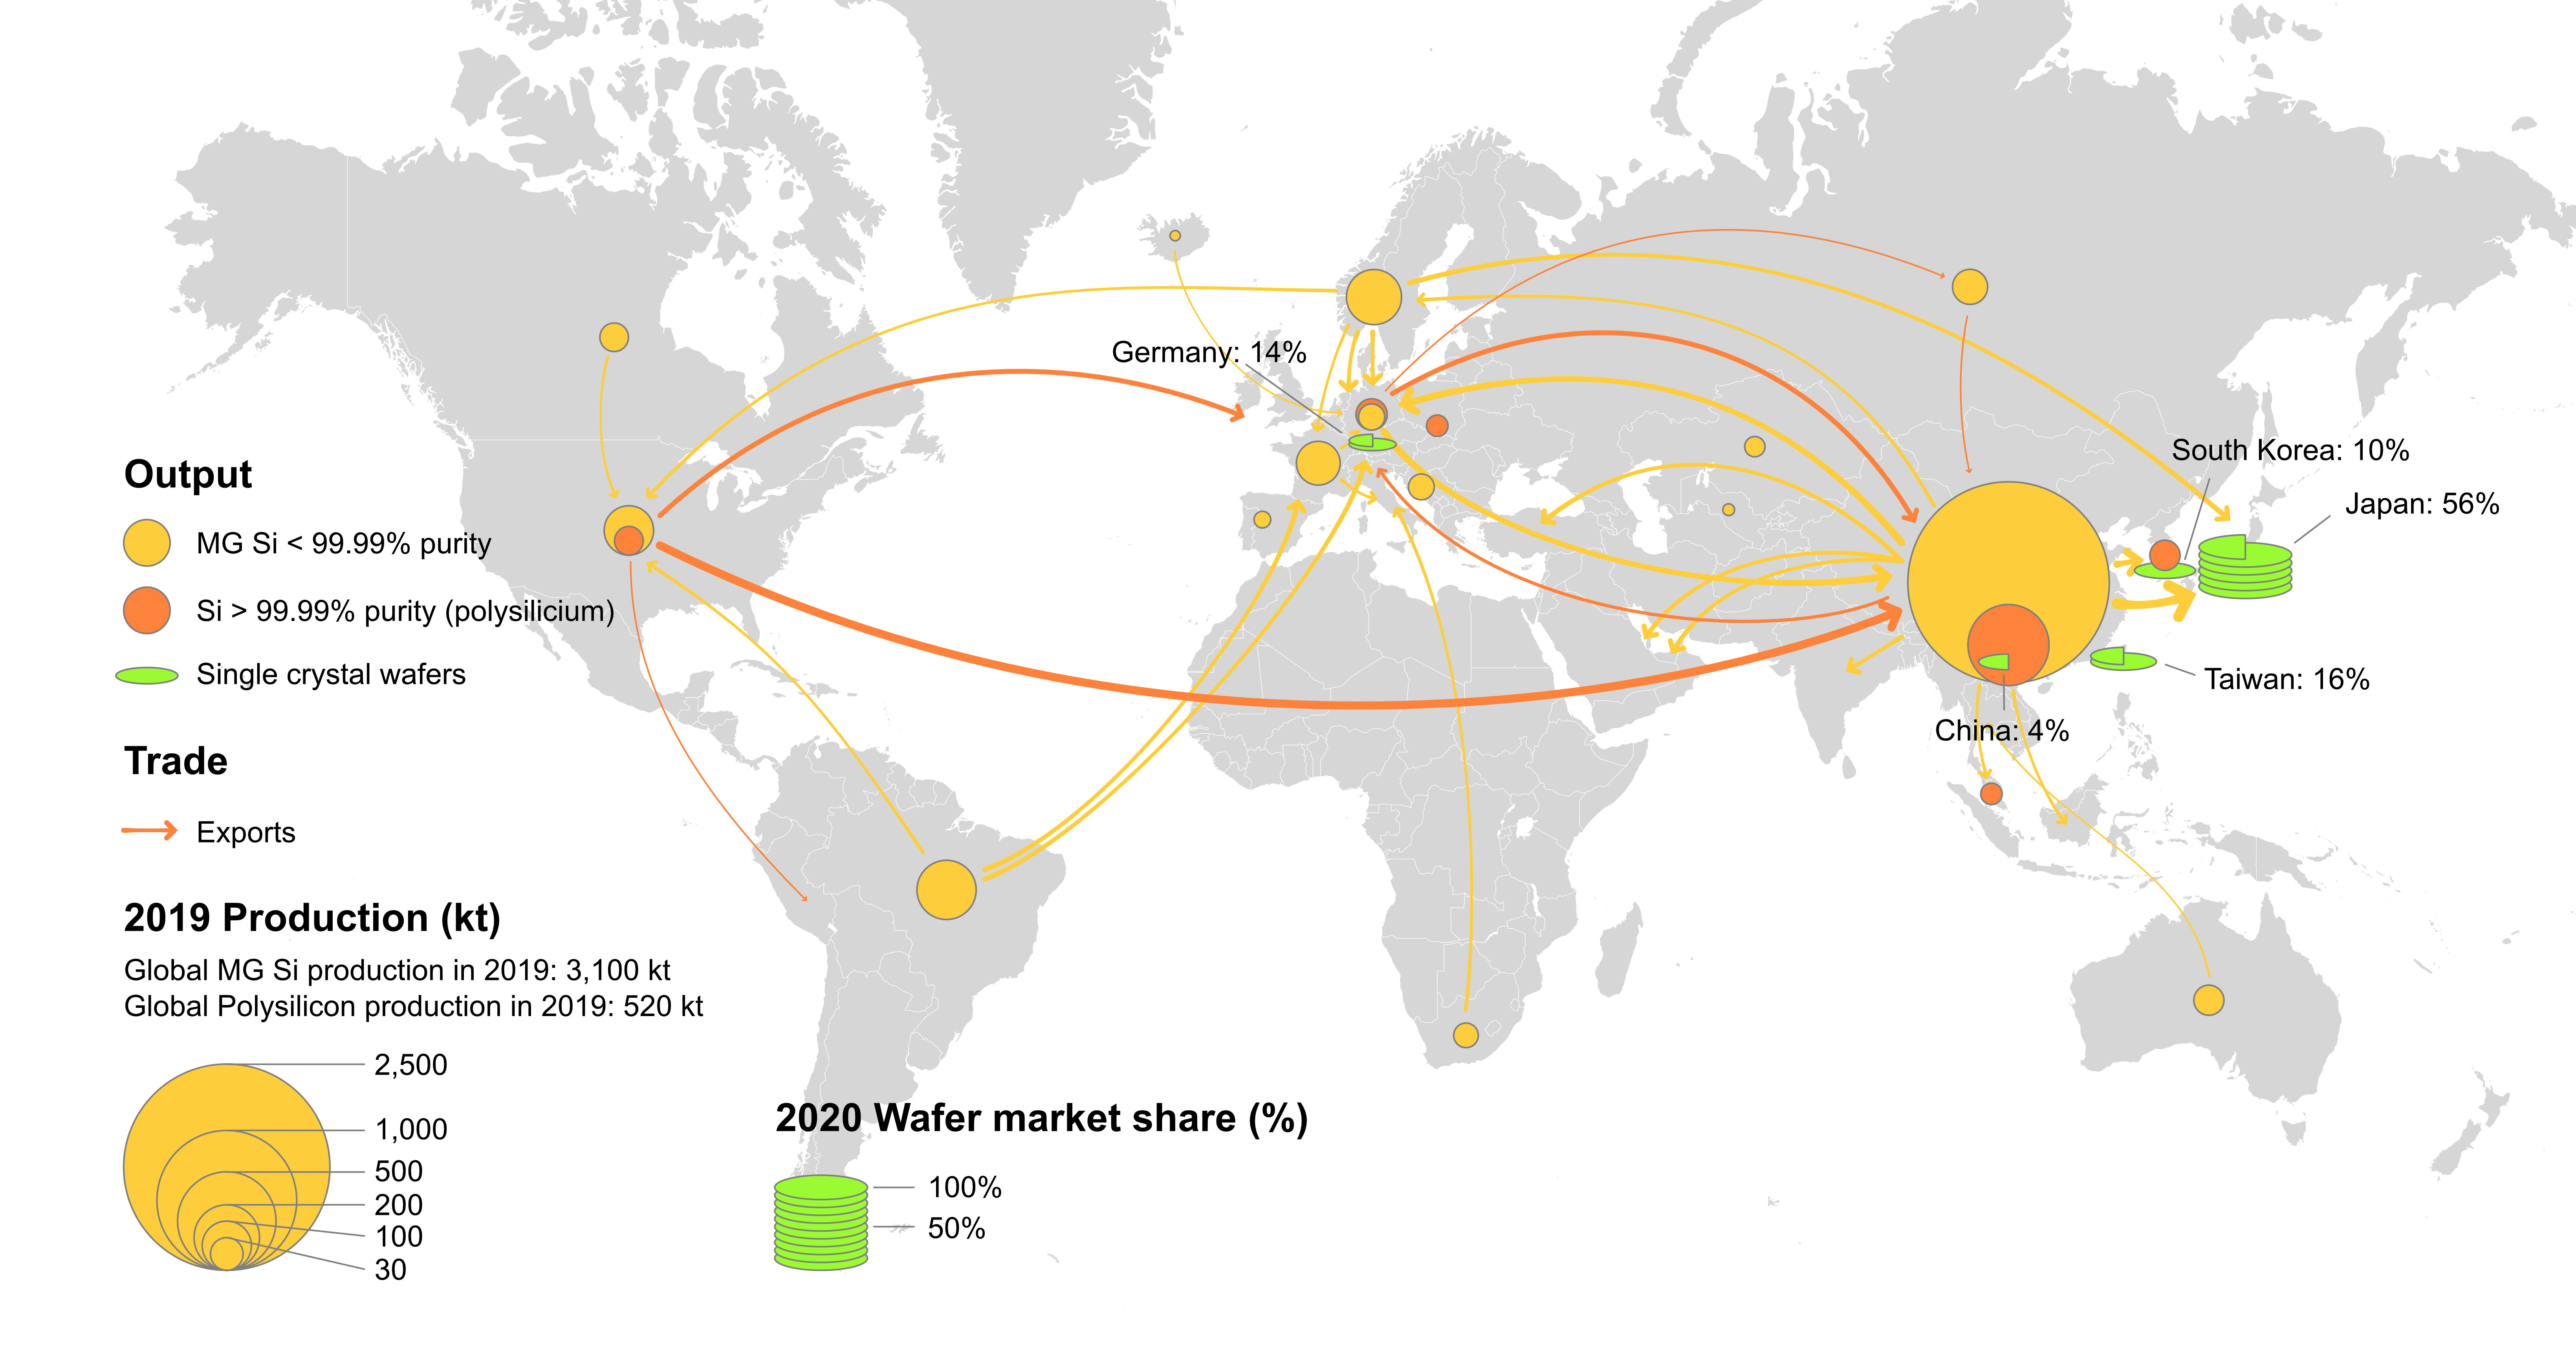
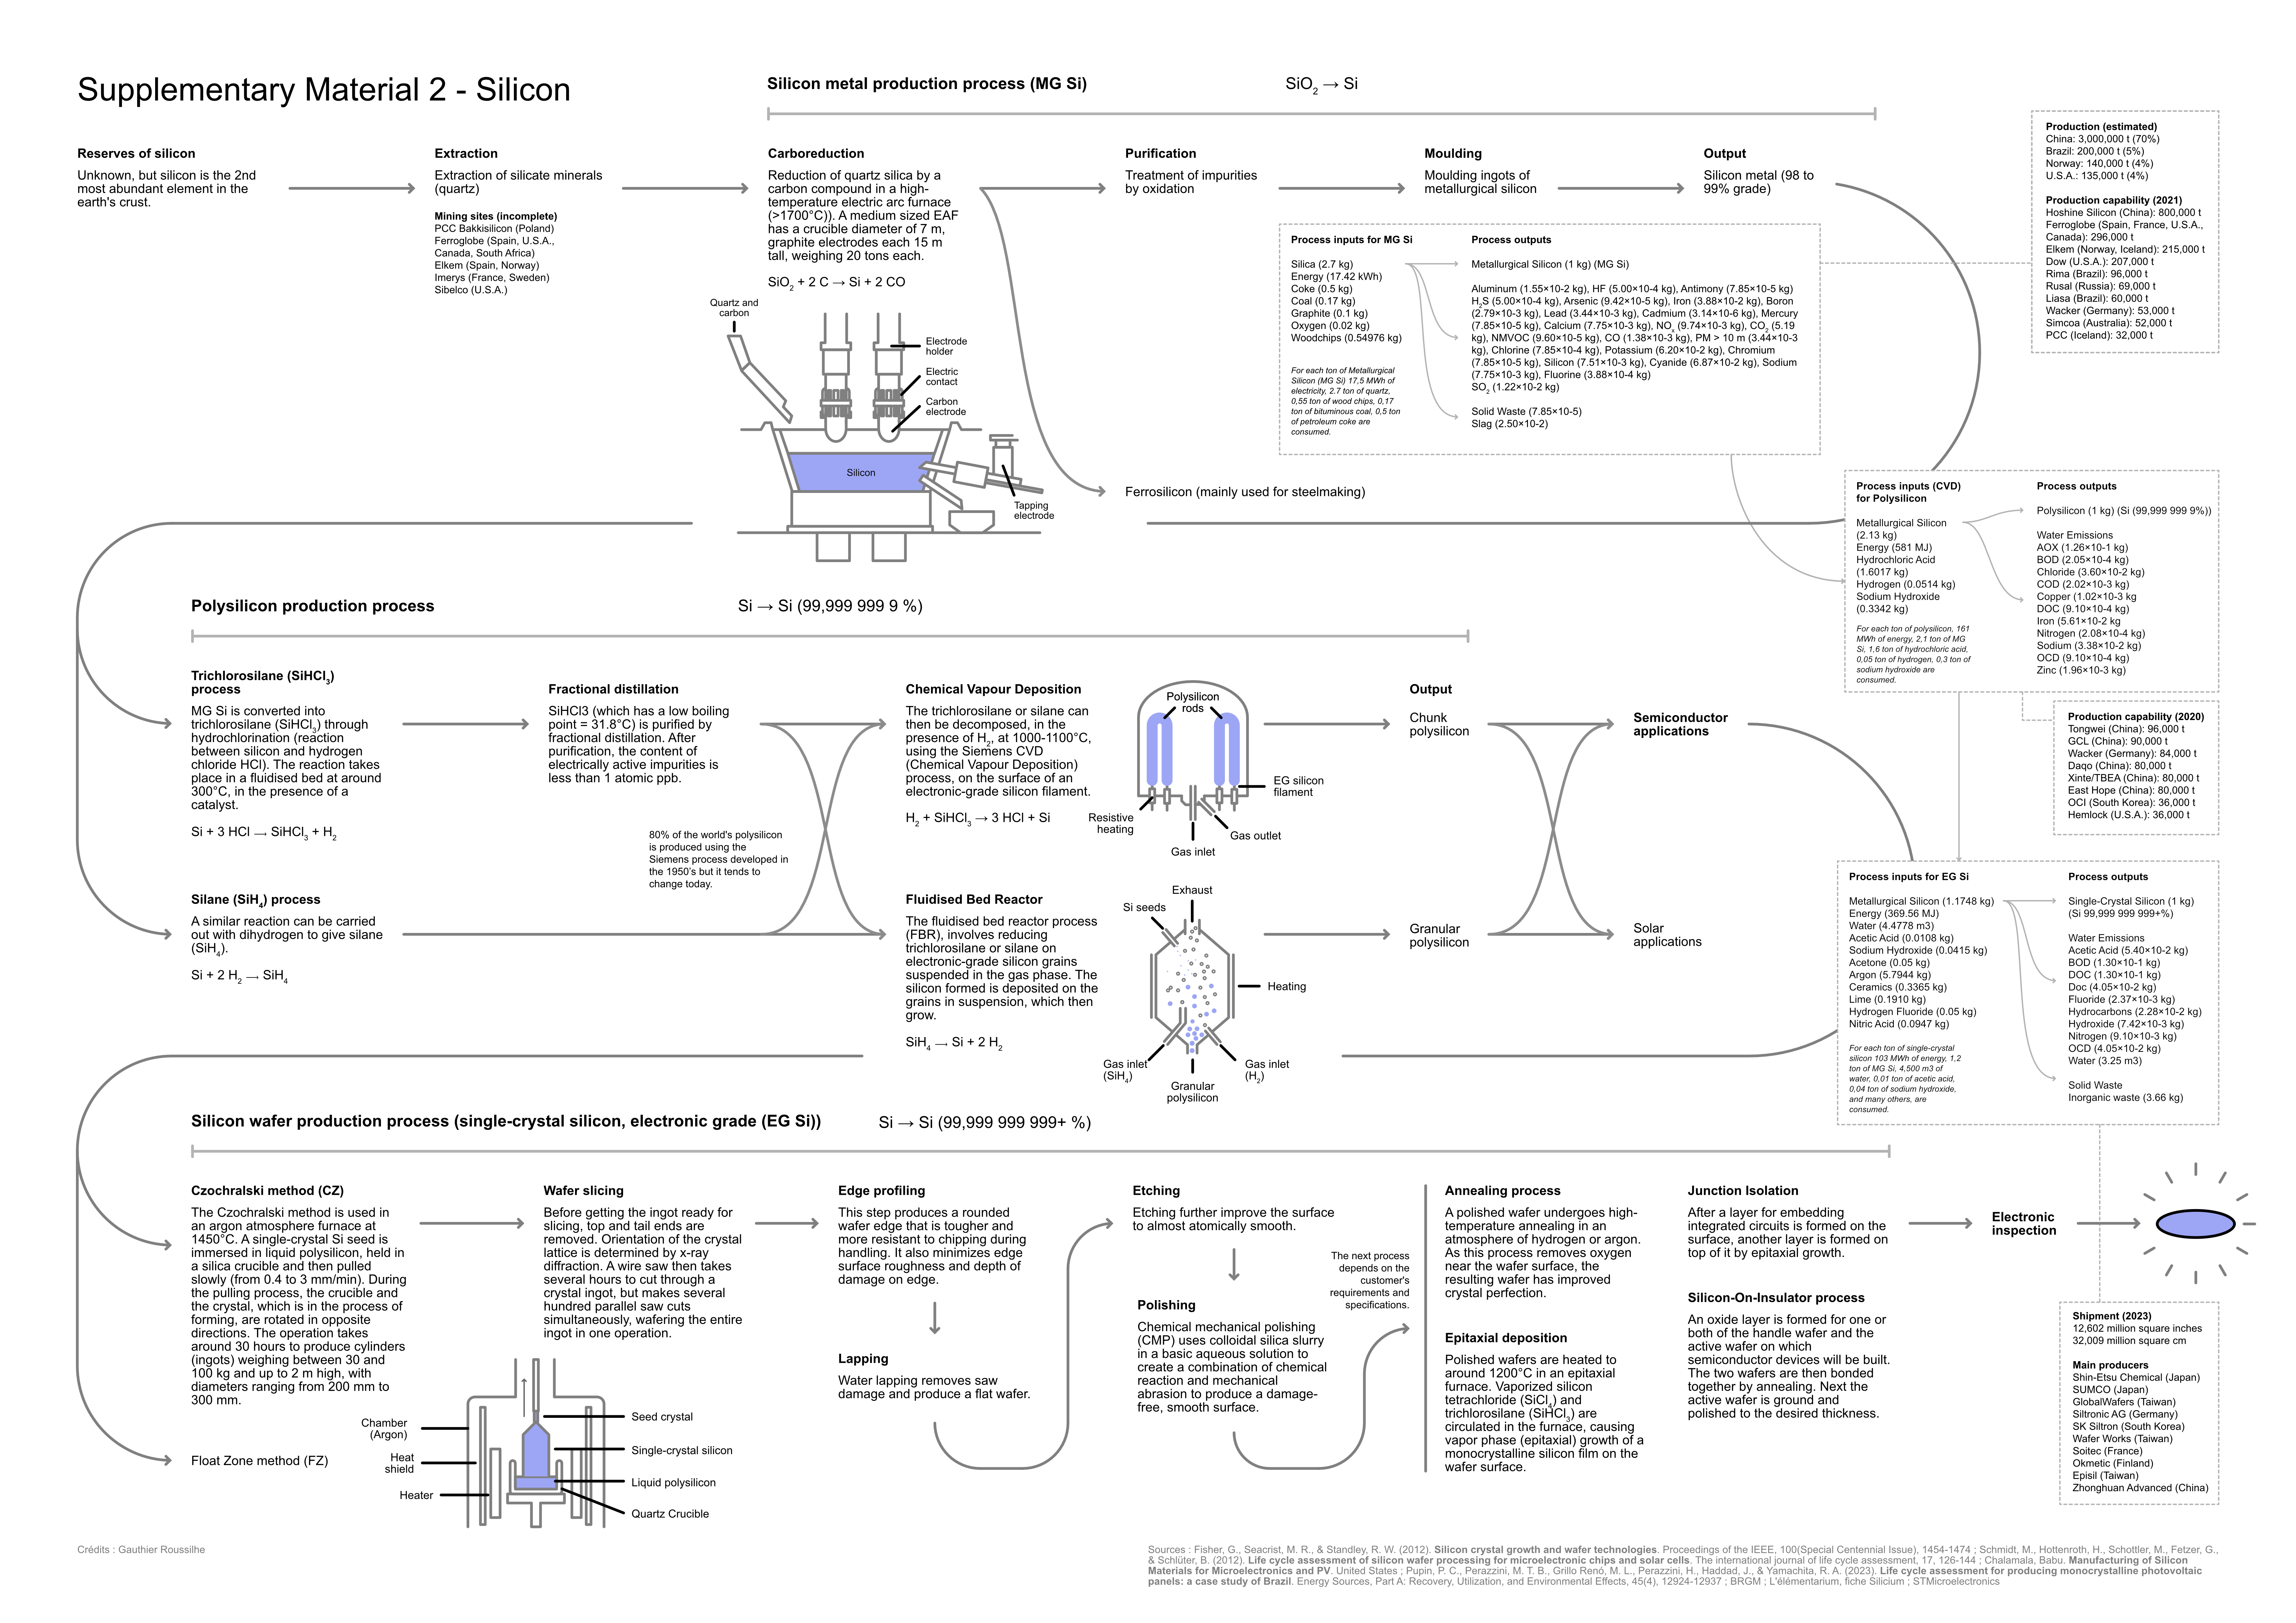
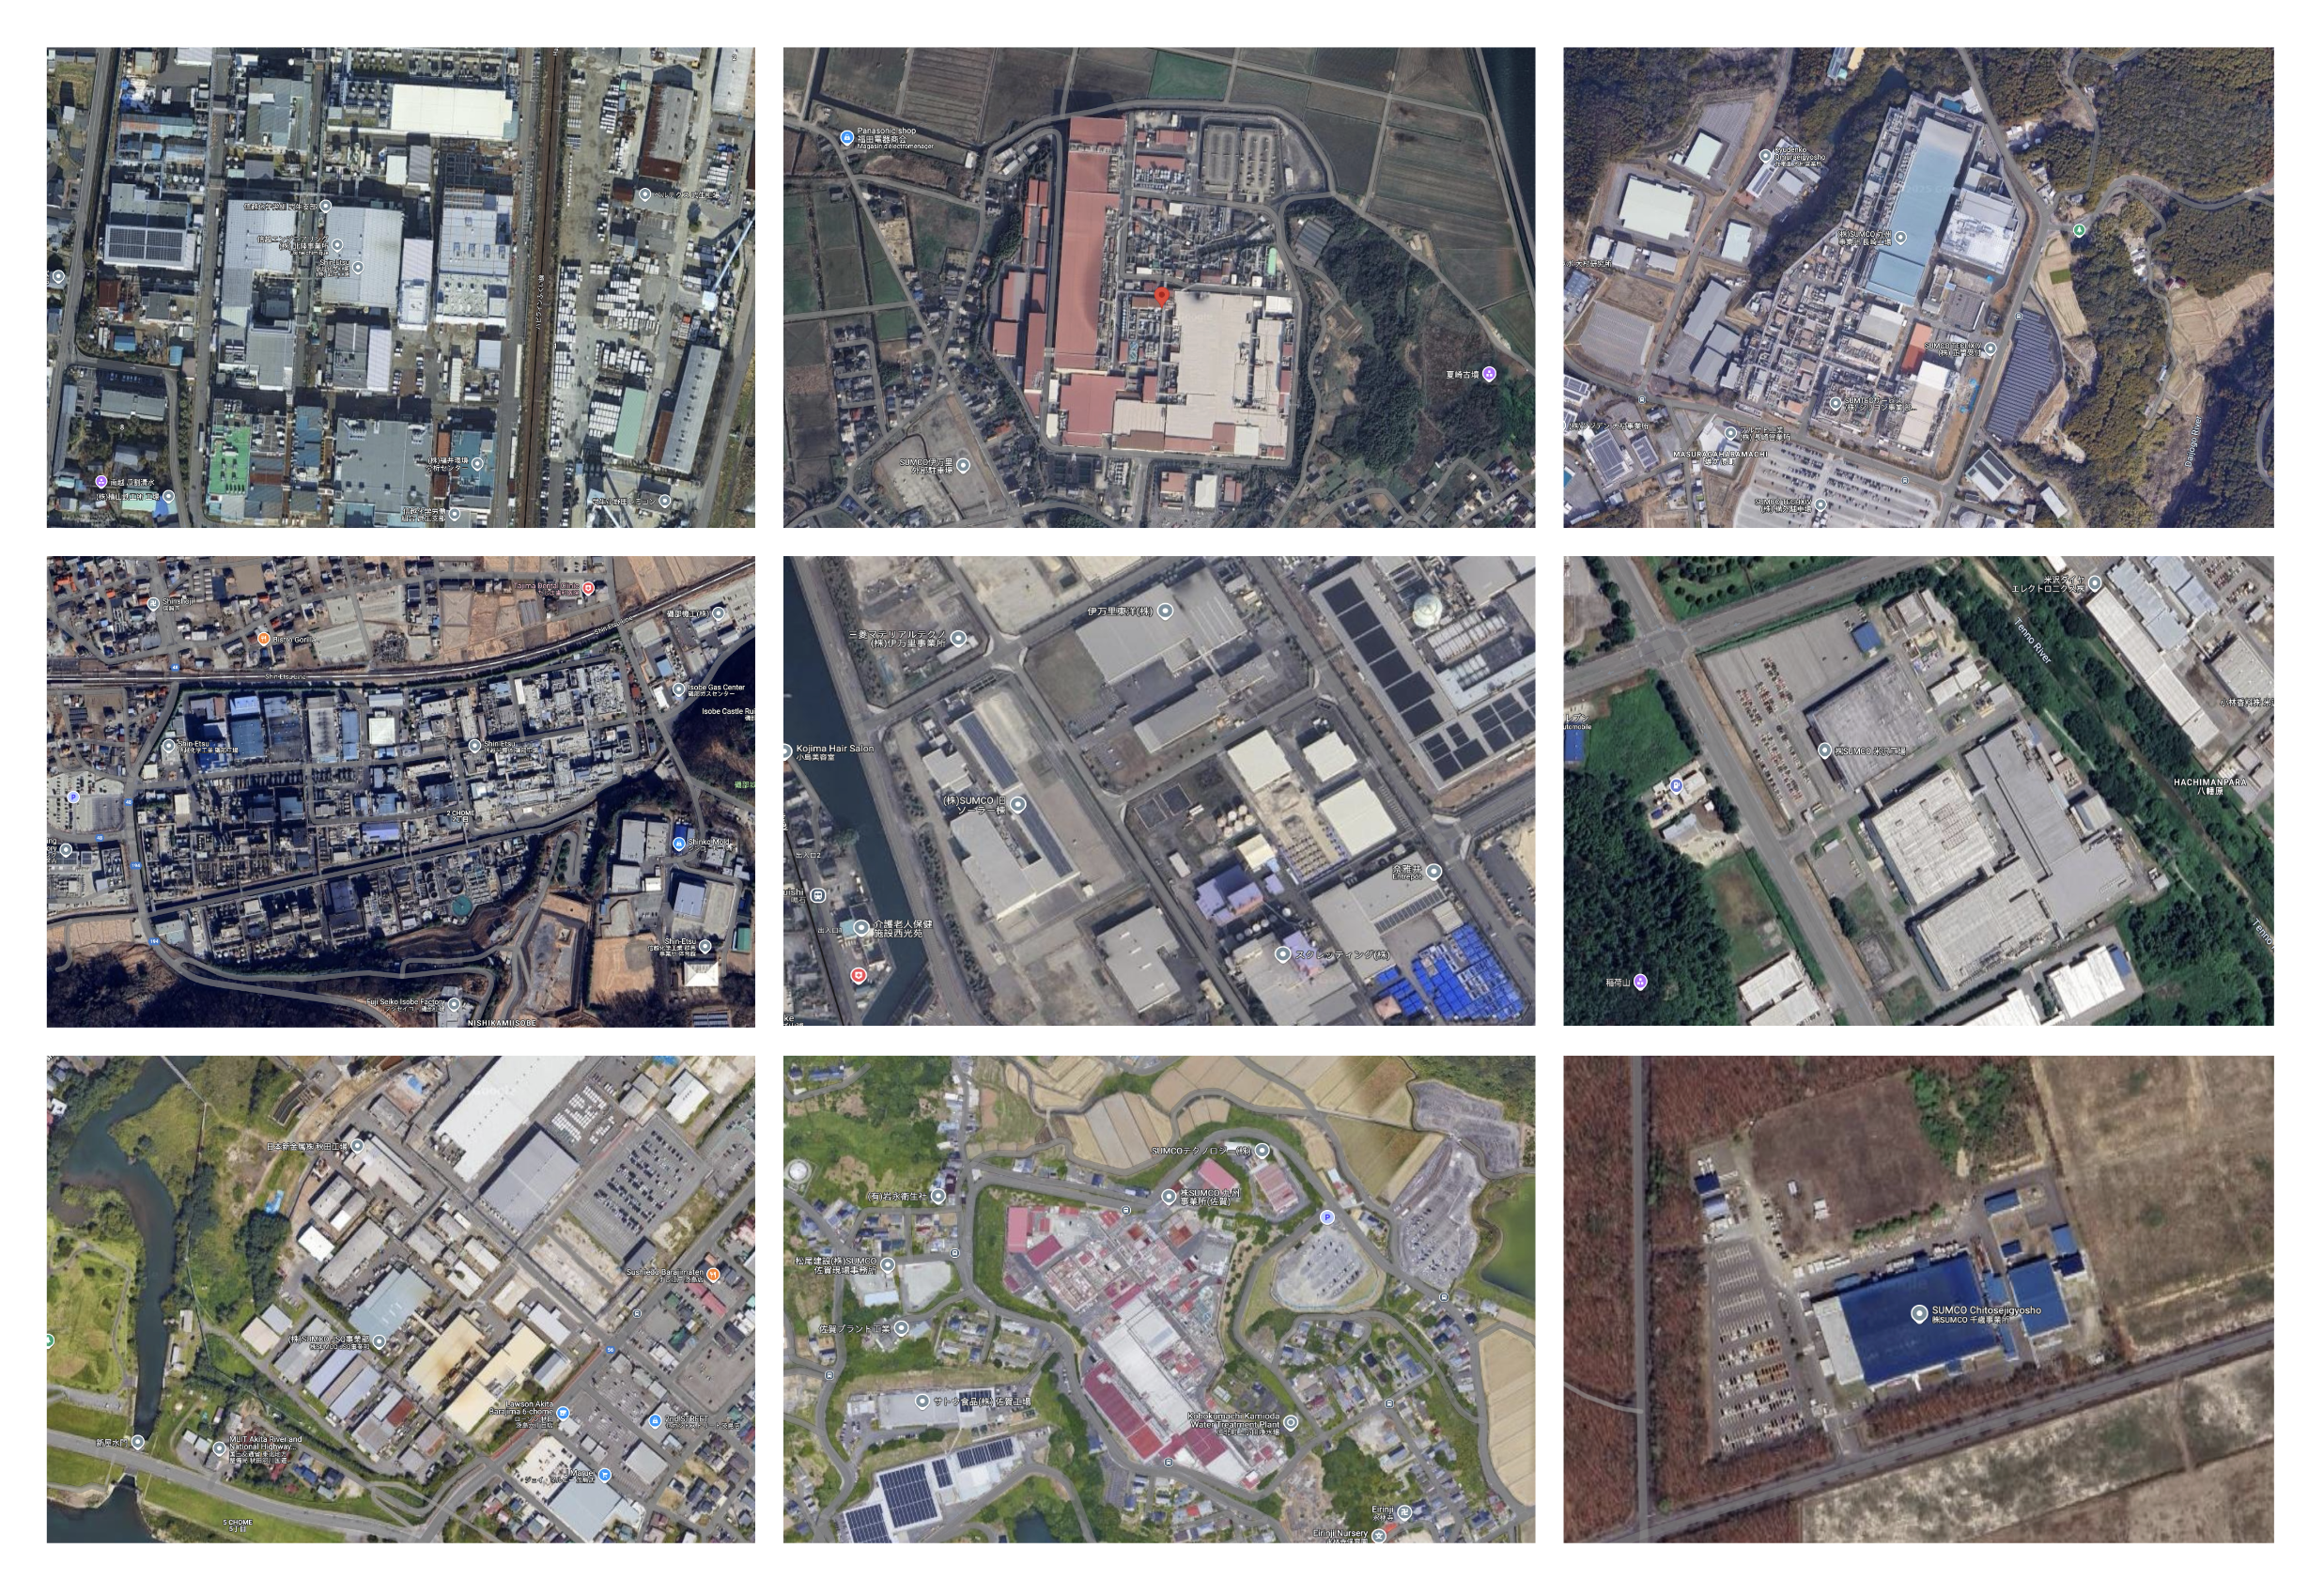
Silicon is without doubt one of the best-known elements in the digital sector and at the heart of the modern electronics industry. Nevertheless, only a fraction of the silicon extracted is used by the electronics industry. According to the French Geological Survey (BRGM), while 4,093 kilotons of quartz were extracted in 2019, only 41 kilotons went into the electronics industry, or about 1% of the total flow [24]. This element is more characterized by the purity required than by the quantity extracted. It is one of the elements with the highest purity requirements in the semiconductor industry, 11N (99.999999999%) or even higher. Numerous industries are therefore required between the extraction of quartz and the production of ultra-pure silicon. […] The case of silicon shows how the demand for purity quickly isolates upstream supply chains, as illustrated in Figure 6. This highlights two critical issues. First, it appears that the geographical concentration of the early stages of purification is in China, like many other elements. In 2023, it was estimated that China represented more of 90% of the polysilicon production market shares [25]. Then, the concentration of more than half of the production of single-crystal wafers is held by two Japanese companies, Shin-Etsu and SUMCO [26]. […] According to our estimates, there are only 35 factories worldwide capable of producing single-crystal wafers, and even fewer capable of producing wafers for advanced semiconductors (300 mm) (see Supplementary Materials). The ultra-pure silicon production value chains are a typical example of a small group of countries’ mastery regarding the material basis of the digital sector. In this case, the increasing demand for purity is exacerbating bottlenecks, which creates scarcity even for an abundant element such as silicon. Furthermore, such purity requirements have a significant environmental impact, particularly the transition from polysilicon to single-crystal silicon [27].
The case of neon
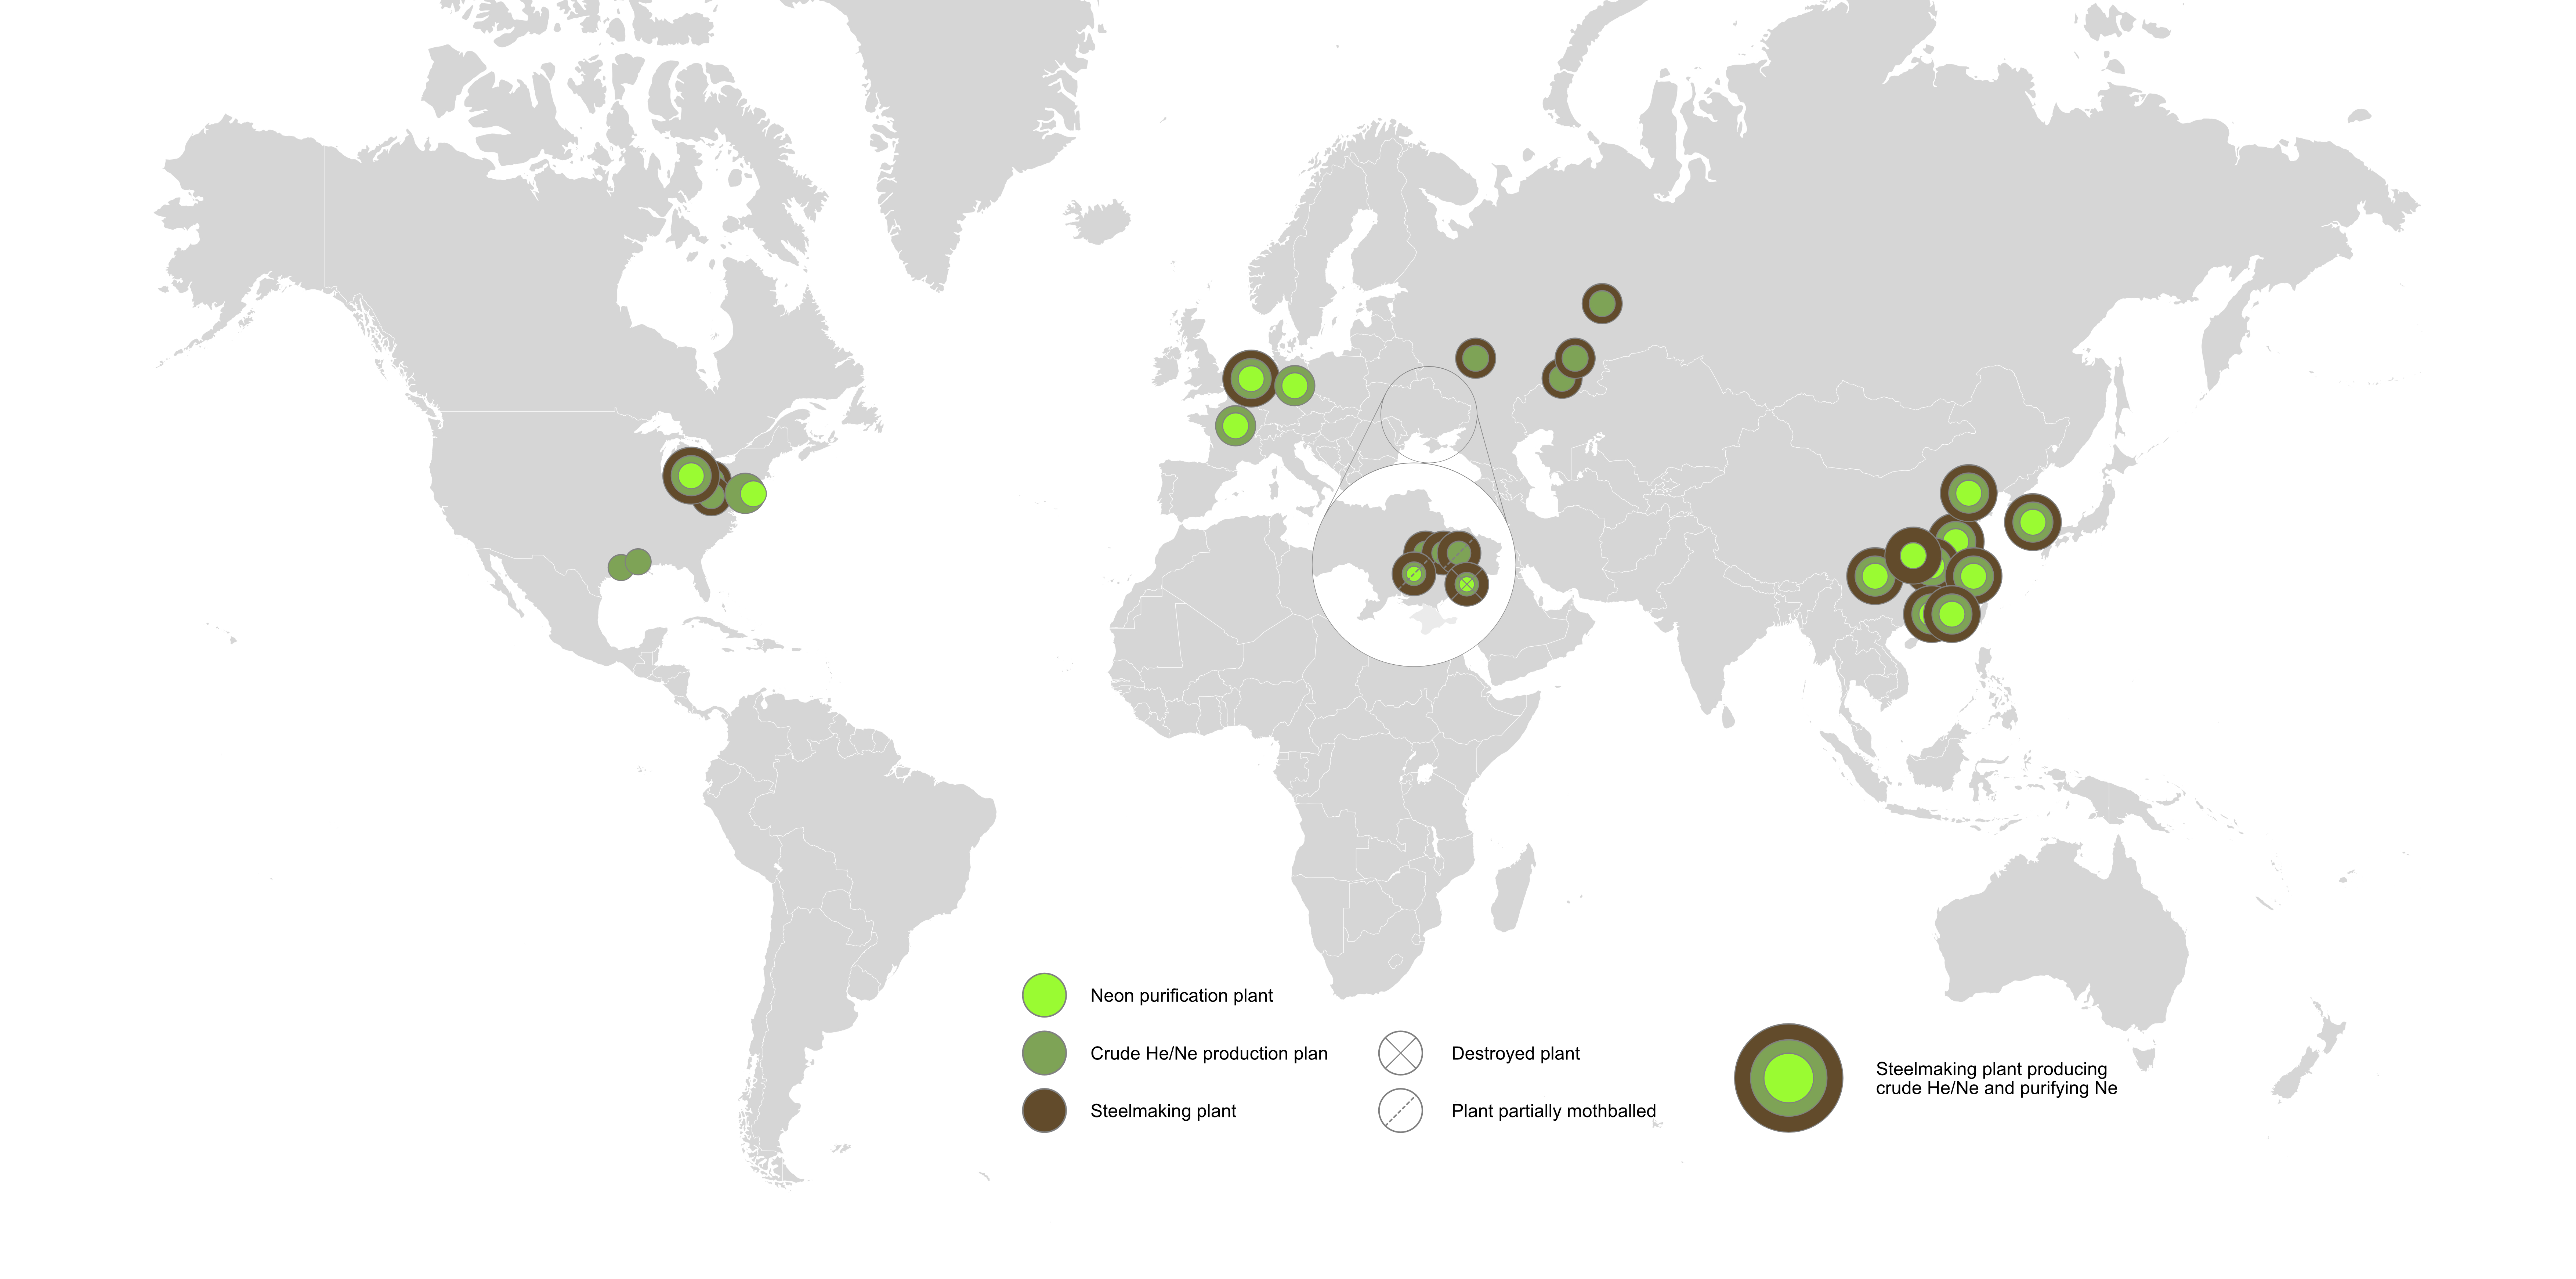
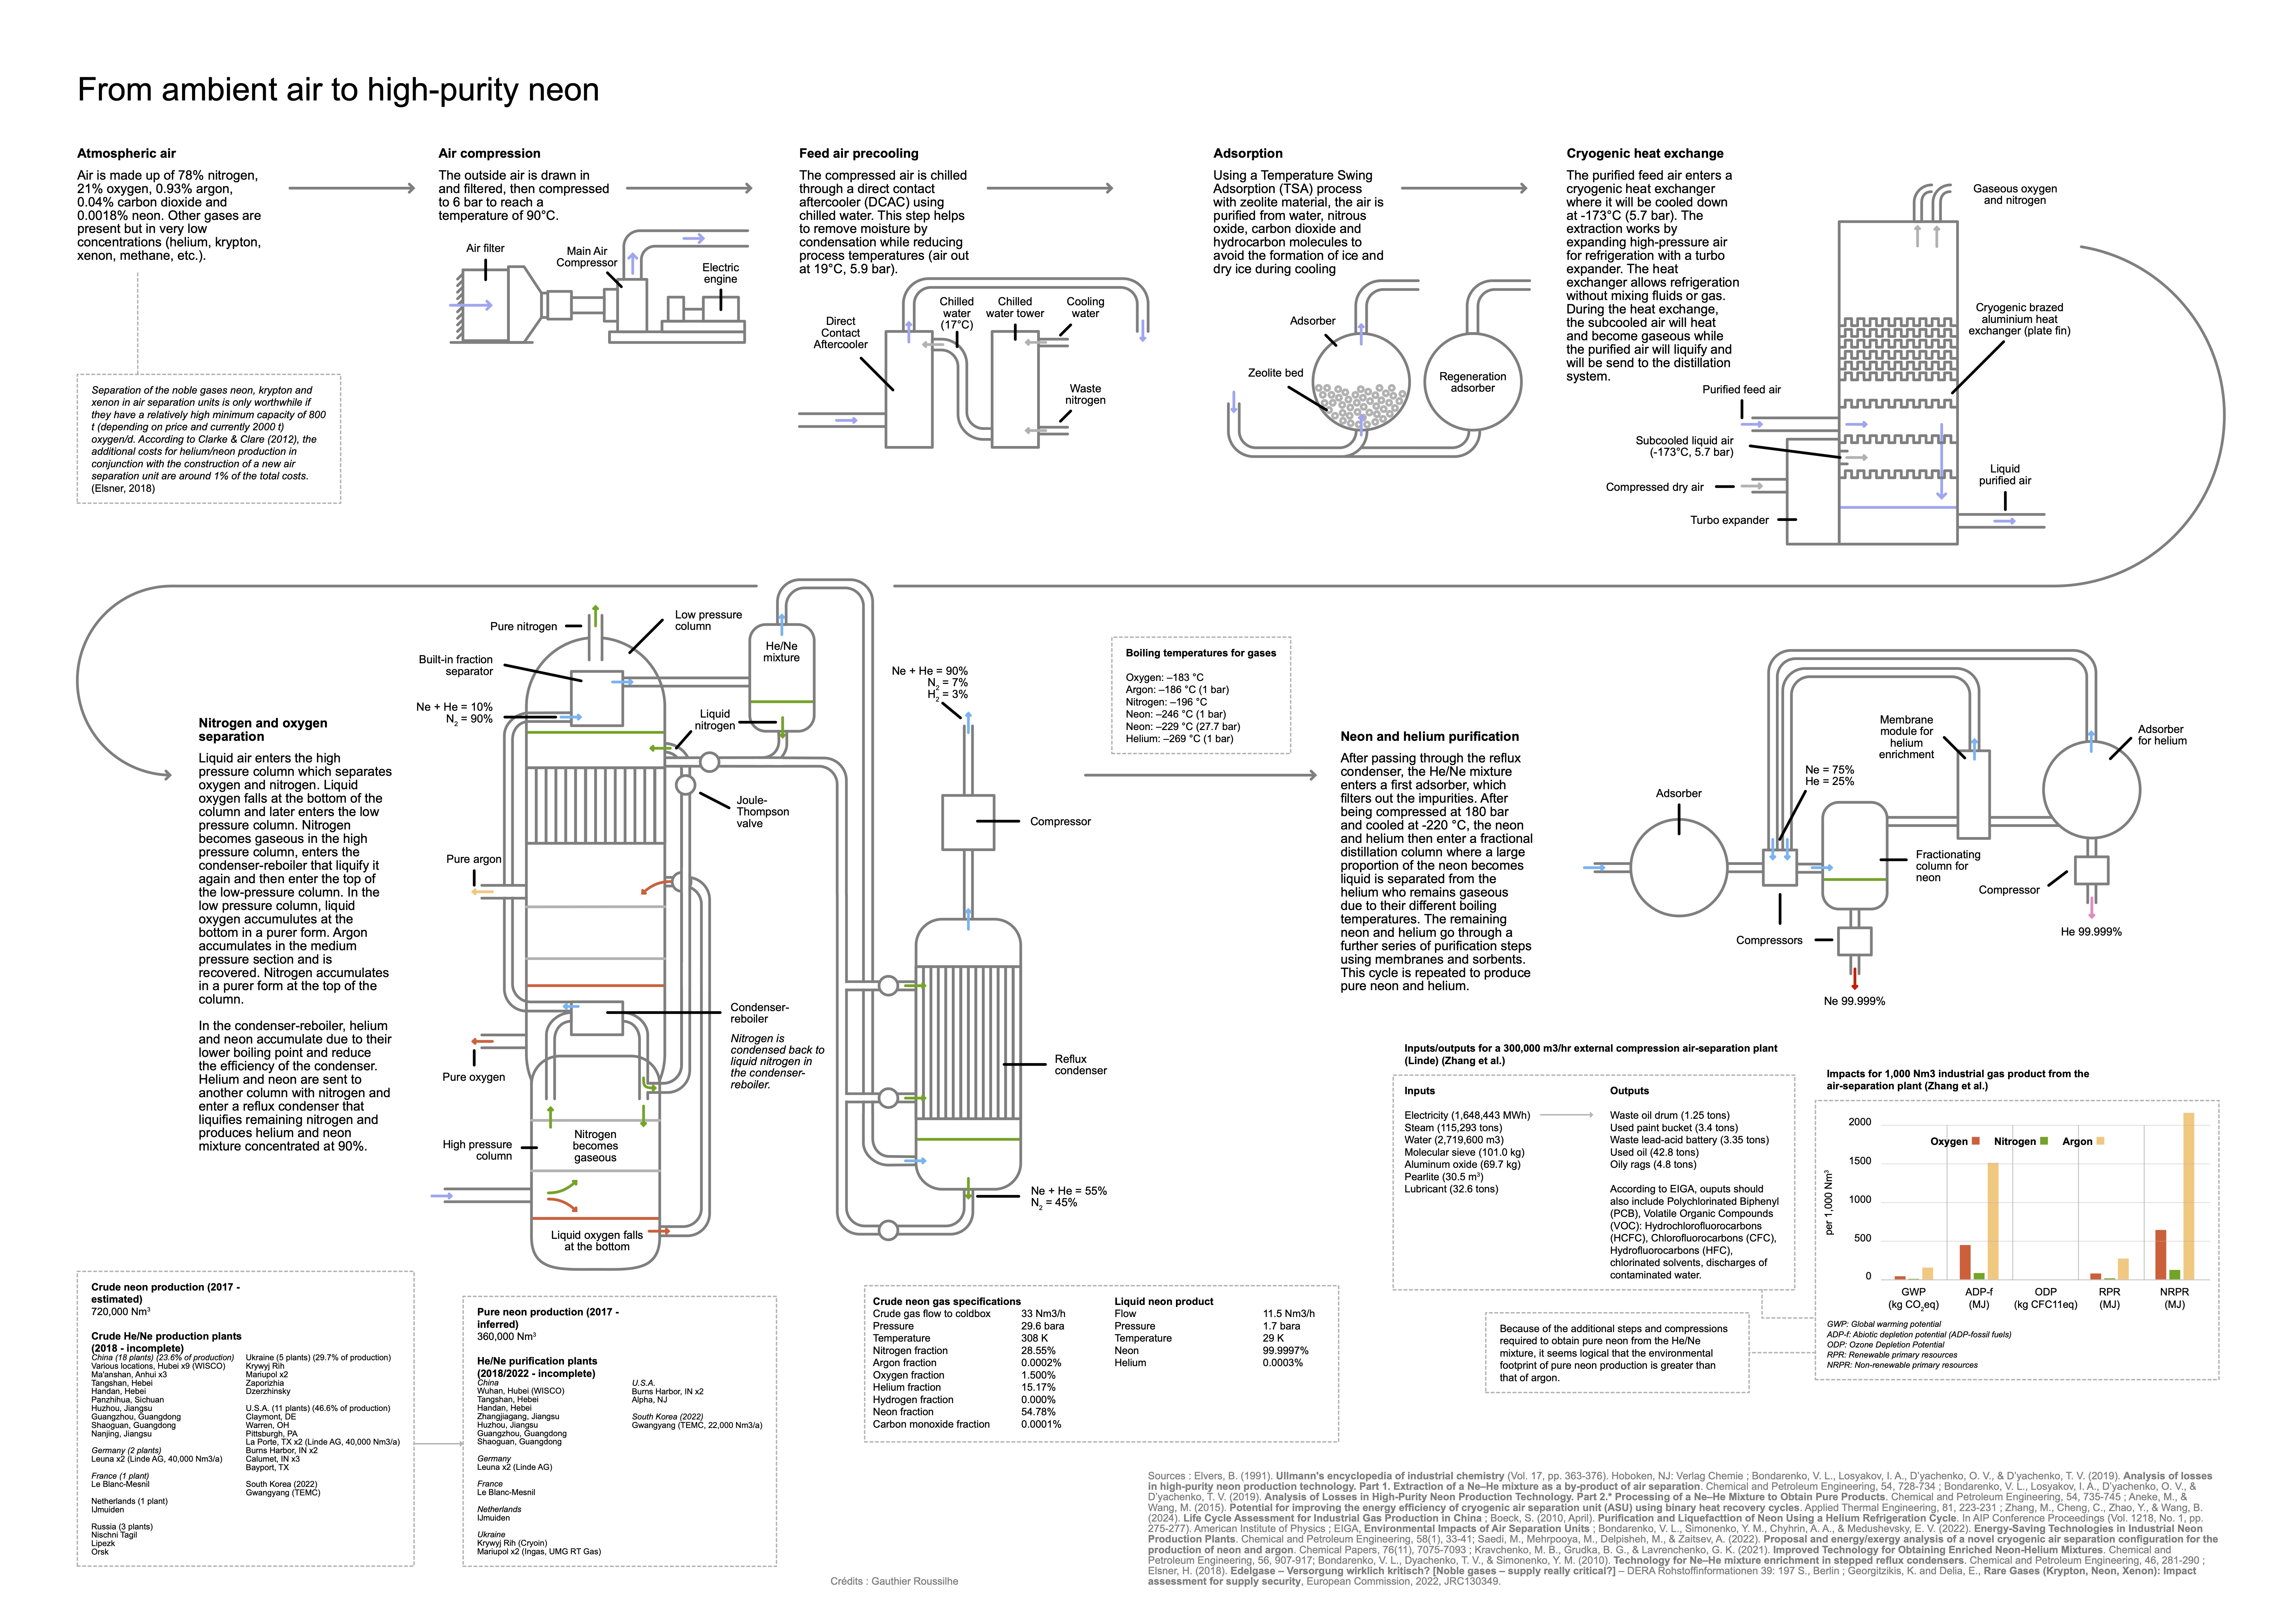
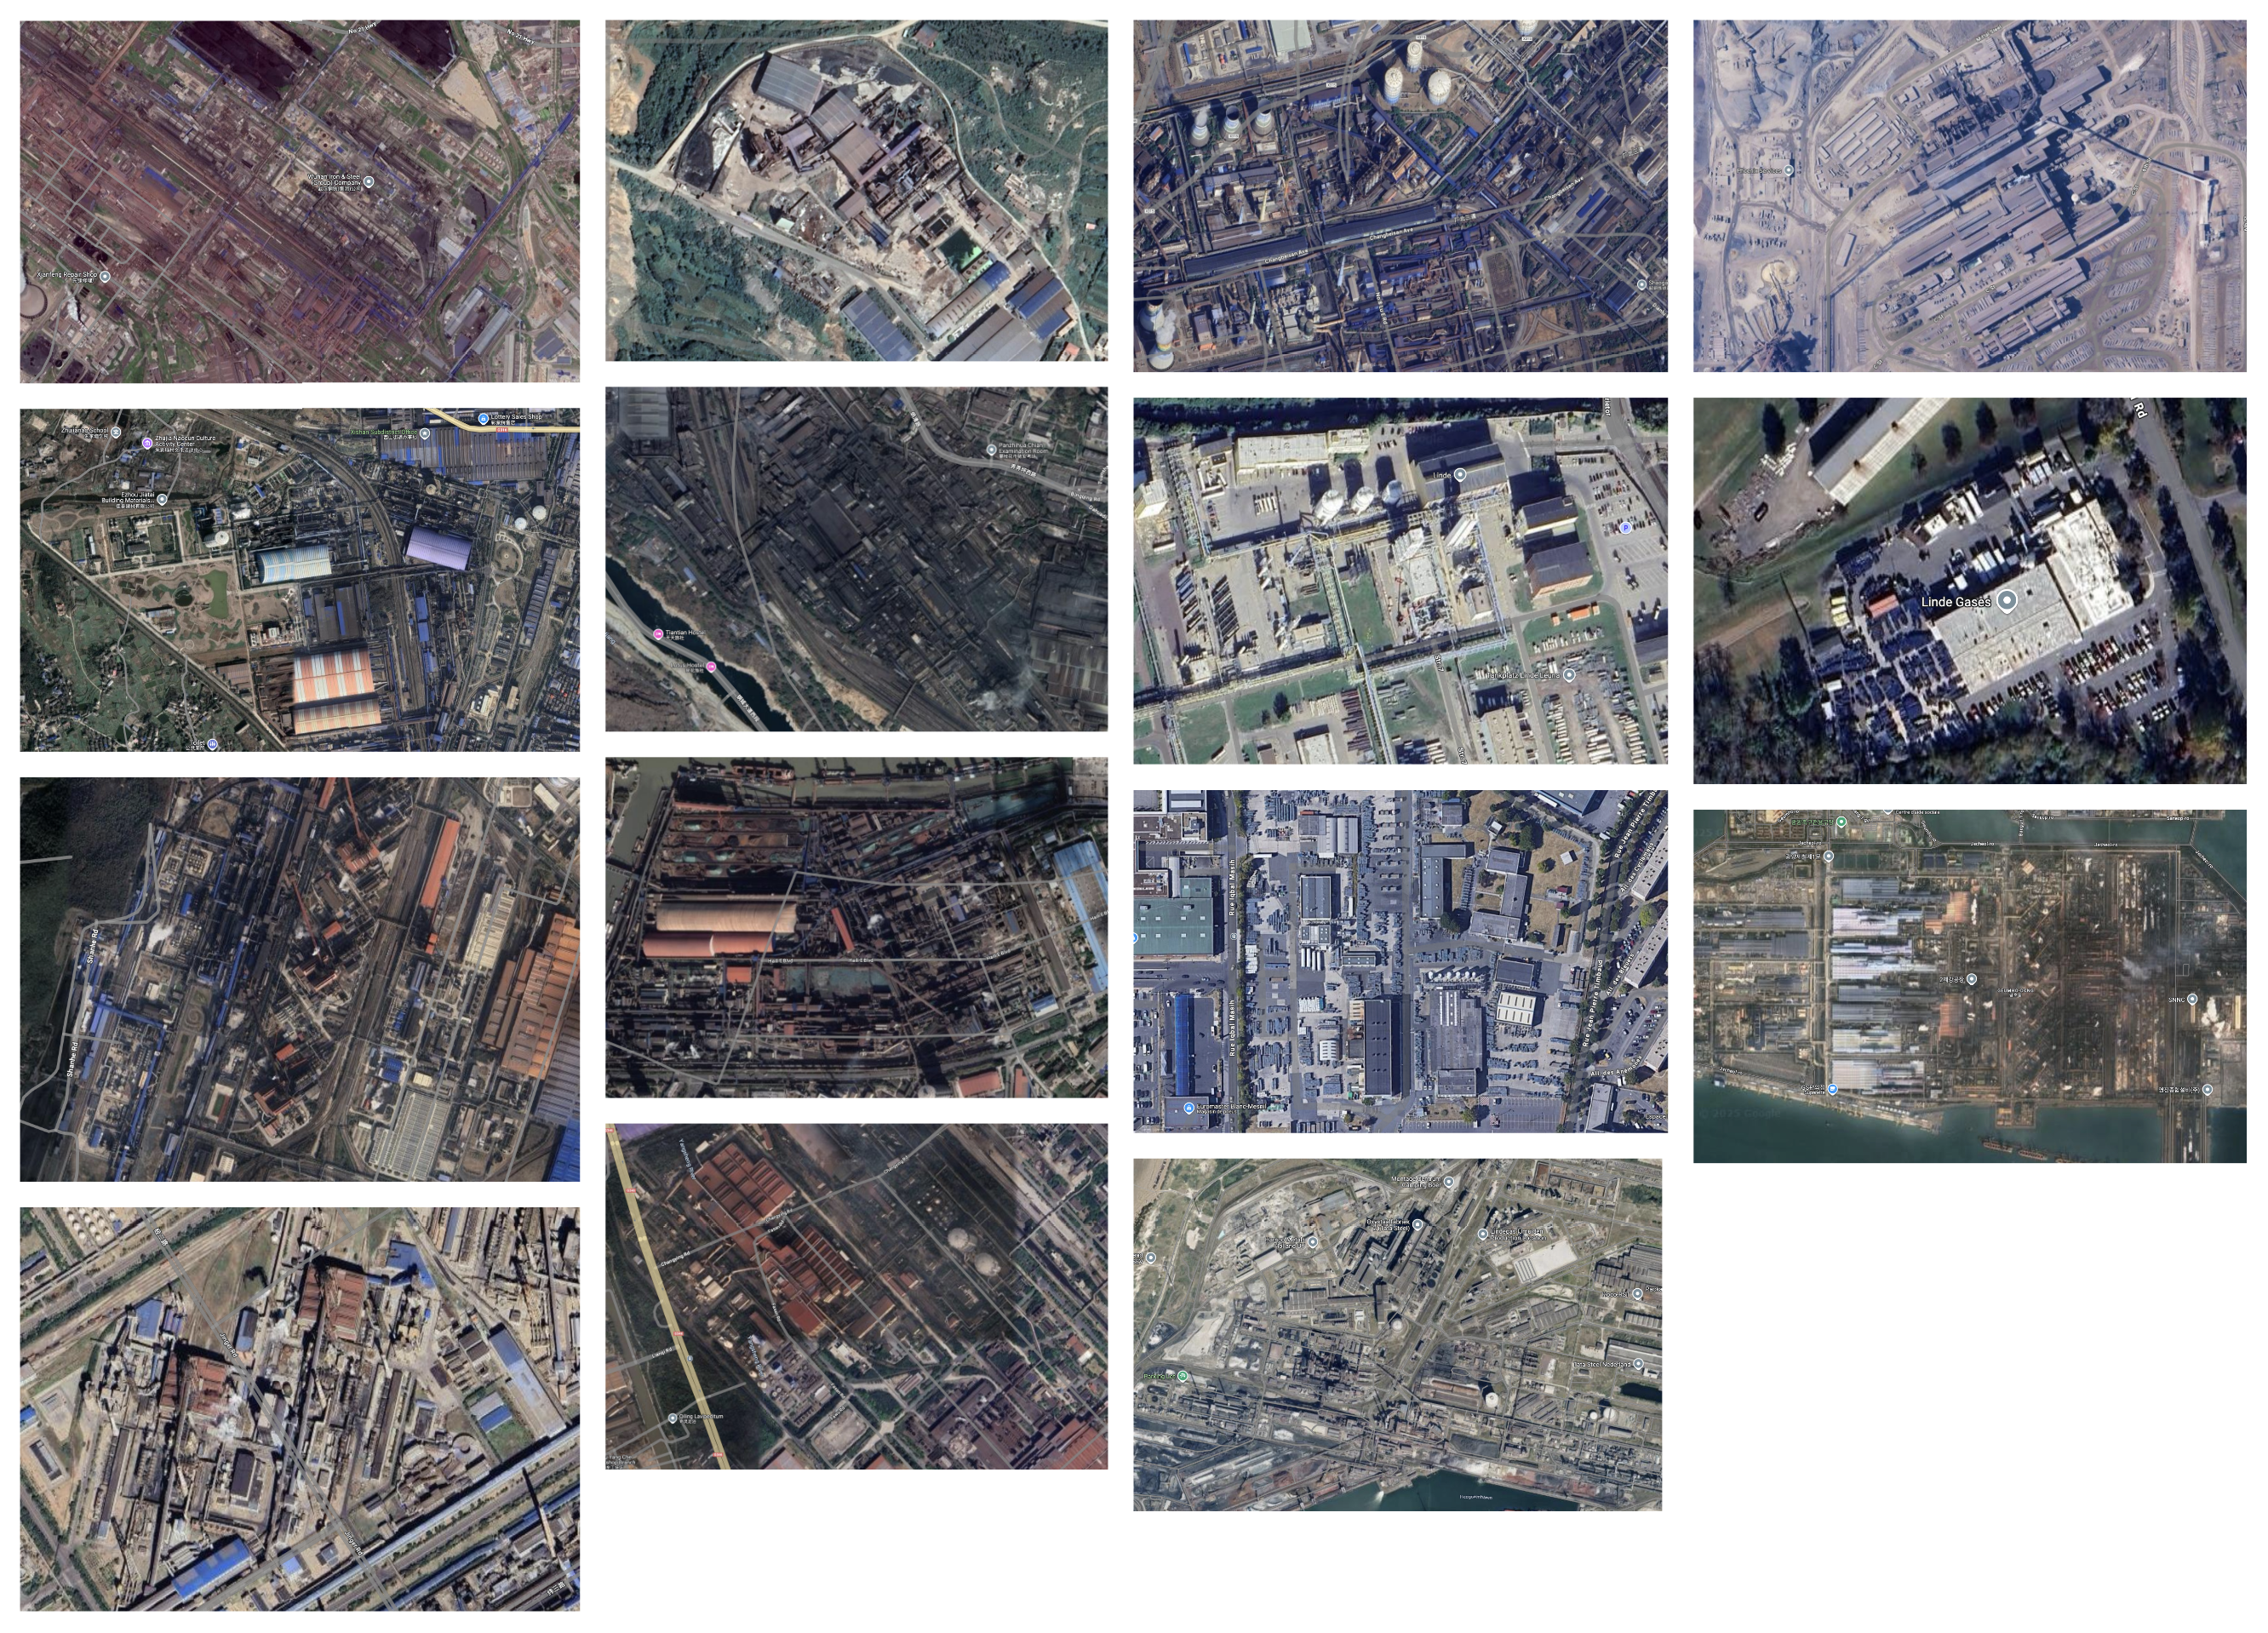
Gases seem to be rarely considered in material studies, likely because (i) they can theoretically be extracted anywhere on Earth, unlike minerals, and because (ii) they might be less obviously related to materiality than ores or minerals. However, semiconductor manufacturing heavily relies on gases. […] Although all air separation units are theoretically capable of extracting and reusing neon, only a small number of them do so. Based on the last publicly available data, 40 plants could produce crude He/Ne in 2017, and only 18 He/Ne plants could purify neon in the world [35]. According to [36], it becomes profitable to produce neon if the air separation plant produces at least 800 tons of oxygen per day. The largest air separation plants are generally associated with steelworks that consume large volumes of oxygen for their blast furnaces and can integrate He/Ne mixture production lines. The production of ultra-pure neon hence, depends largely on the mass production of steel.
Session 7 : Manufacturing
Making electronic components
Before going any further it is necessary to have a basic understanding of what electronic components are and how they are made. Electronic components are generally classified into different families according to their function and physical properties. There are many ways of classifying them but there are three main categories: active components (diodes, transistors, ICs, optoelectronics, displays), passive components (resistors, capacitors, sensors, etc.) and electromechanical components (switches, fuses).

Close-up of a microcontroller (left) and side view of a microprocessor (right) - Credits: Eric Schlaepfer and Windell H. Oskay
Within the integrated circuits there are still different families, called logic, i.e. with logic/electronic gates (diode/transistor/resistor logic). The integrated circuits that interest us are the CMOS (Complementary Metal Oxide Semiconductor) logic components used for microprocessors or memory components.
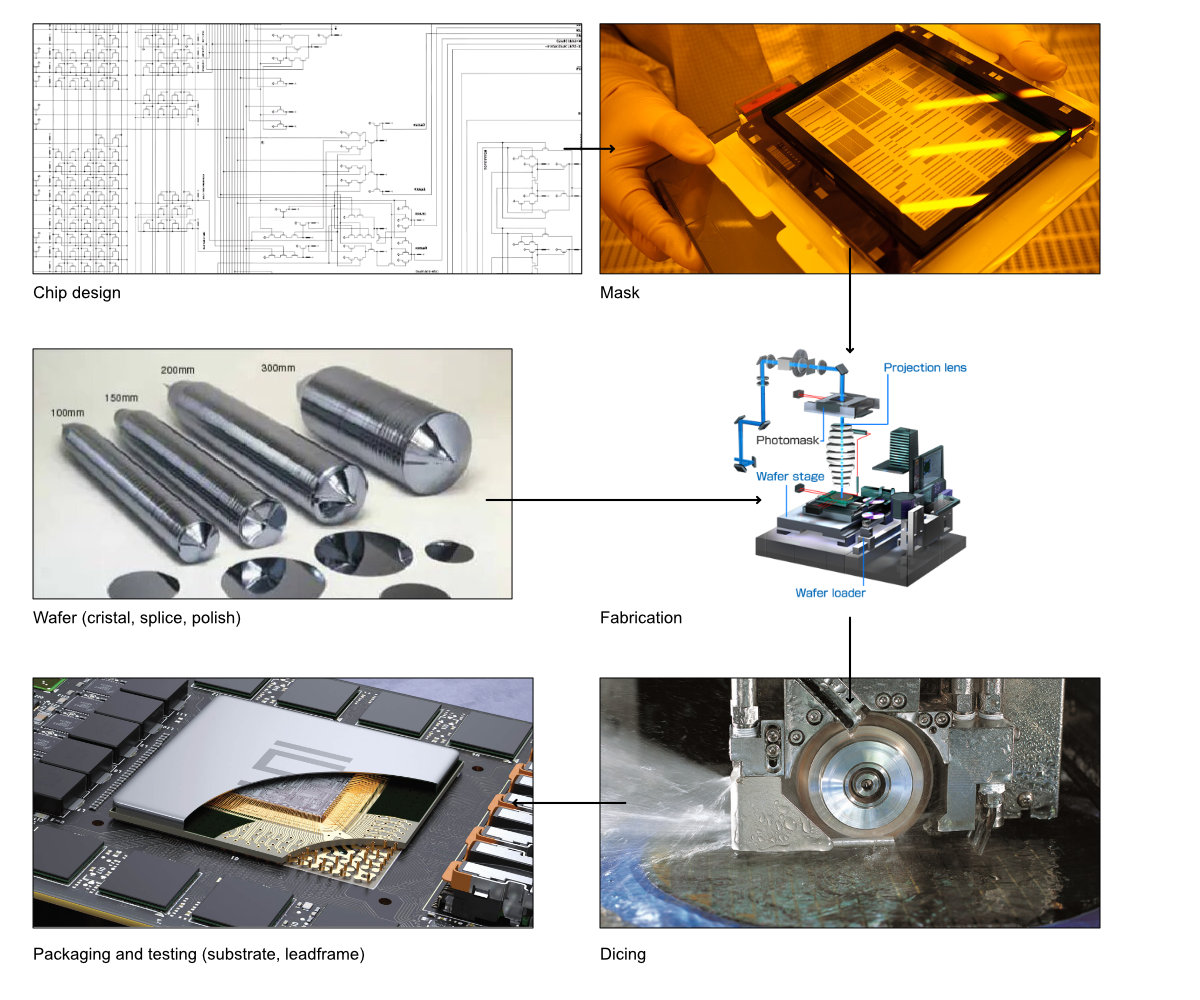
Manufacturing process for ICs
Processors are etched on silica disks, called wafers, doped with another element (e.g. Boron) to modulate their electrical and structural properties. The electronic circuit patterns are affixed to masks that guide the etching, like the negative of a photograph. A wafer allows many circuits to be etched at once, and these circuits are cut with a saw. They are then packaged, i.e. the component connectors are plugged in and tested, and placed in a plastic frame to prevent damage. These components are then sent downstream to the other industries to be soldered onto a circuit board.
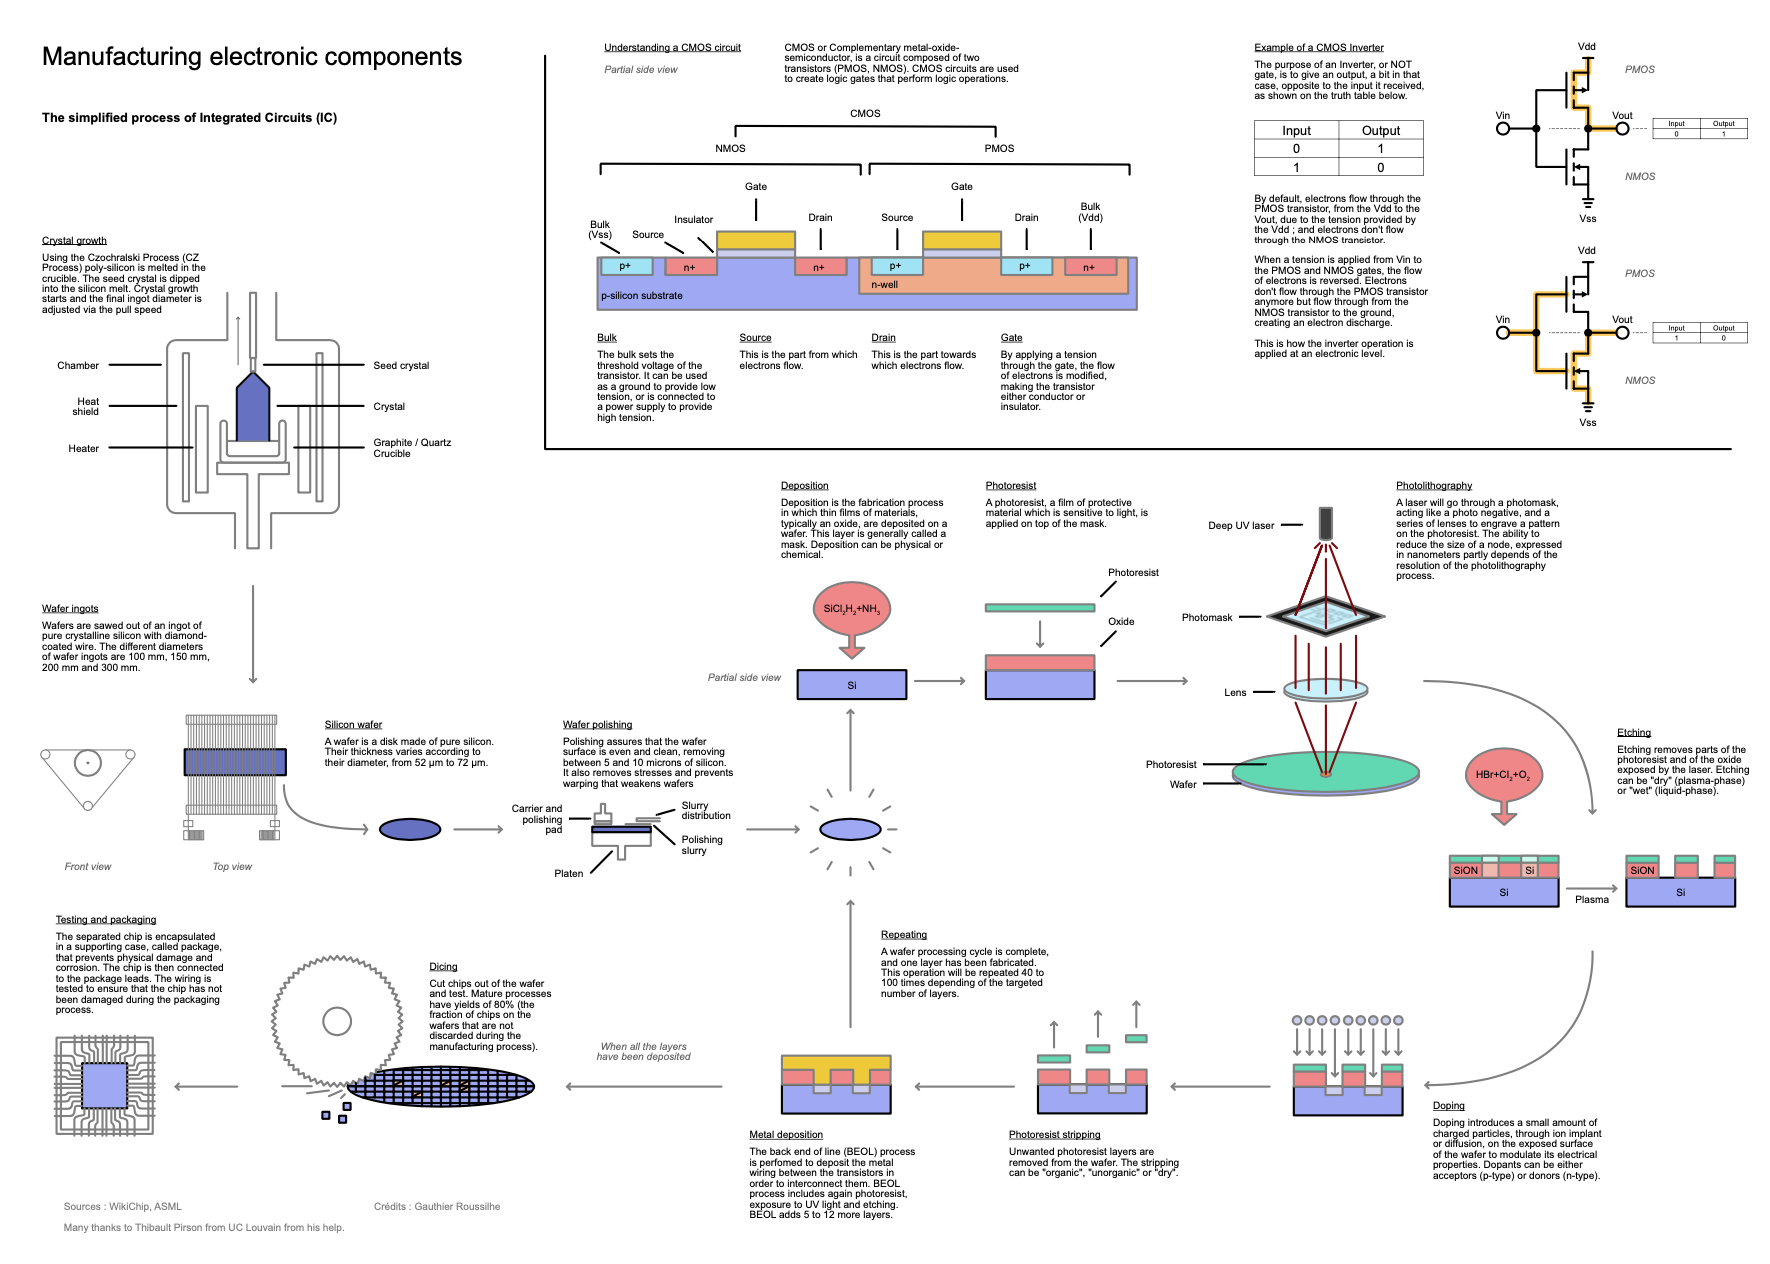
Simplified processes for making ICs, see high-res here
The machines that allow this type of production are very expensive, especially those for engraving. Every year manufacturers produce smaller transistors and can therefore fit more on the same surface. The more transistors there are, the more computing power there is. Today, the most advanced methods engrave at 5nm (the distance separating each transistor from the other) but the physical limit is 2nm and we will reach it within a decade. Today, there is only one type of process that allows us to etch below 7nm, and that is Extreme Ultra Violet. Only one manufacturer produces machines using this process, ASML, and 90% of the production capacity below 10nm is located in Taiwan
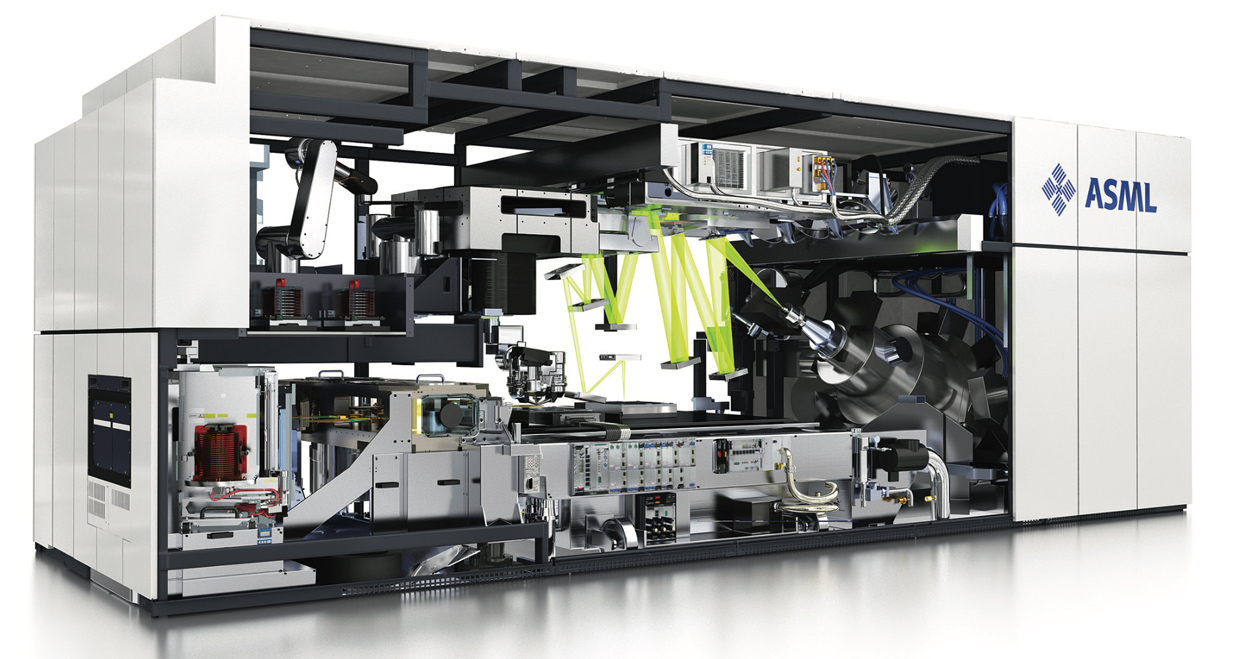
NXE:3400 machine from ASML
Environnemental impacts of engraving
This section uses the research paper from Pirson, Thibault ; Delhaye, Thibault P. ; Pip, Alex ; Le Brun, Grégoire ; Raskin, Jean-Pierre ; et. al. The Environmental Footprint of IC Production: Review, Analysis and Lessons from Historical Trends. In: IEEE Transactions on Semiconductor Manufacturing, Vol. 36, p. 56-67 (2023) http://hdl.handle.net/2078.1/268615 – DOI : 10.1109/tsm.2022.322831
Technological advances have led to a reduction in engraving size. However, this reduction implies an increase in the industry’s use of resources (water, energy, gas, etc.) and the associated environmental impact.

> In conclusion, [...], we show that the environmental impacts per area are clearly increasing with technology downscaling below 0.13 μm. This is observed both in the scientific literature and in LCA databases, despite the scope mismatch. It also seems that this increase is accelerating for advanced nodes

_Node-wise trends based on data from the scientific literature and the LCA databases. This shows the environmental impacts per cm2 with respect to (b) GWP, and (c) water consumption_
In addition to the relative impacts increase in engraving per unit area, the size of chips tends to increase in order to accommodate an even greater number of transistors.
 _Transistors count and die size per release date for CPU (blue) and GPU (orange), [chip-dataset](https://chip-dataset.vercel.app/) _
Thus, although the environmental impact per transistor, or more generally per unit of computing power, is decreasing, the environmental impact of chips is also increasing significantly, as is the number of chips produced, which is leading to an increase in the global impact of the semiconductor industry. This is a classic example of the rebound effect.
Wafer Losses
In progress…
Session 8 : End-of-life
Given the current knowledge and data on digital infrastructures, research primarily focuses on the upstream phase and usage rather than the end of life. Furthermore, the environmental impacts of greenhouse gases, energy, water and metal consumption are better understood than the impacts of chemicals and ecosystem degradation, which are precisely the issues relevant for end-of-life. Although relatively little data is available on these other environmental and health impacts, addressing them is necessary in order to fully appreciate the extent of what remains to be explored regarding the footprint of digital infrastructure.
The end of life for ICT equipment generally means that it is transformed into ‘waste’, i.e. it is no longer usable or recoverable according to the manufacturer’s and the country’s standards. Digital equipment falls into the category of waste electrical and electronic equipment (WEEE). This includes heat exchange equipment such as fridges, freezers and air conditioners; screens such as TVs, laptops and tablets; lamps; large equipment such as washing machines, tumble dryers and dishwashers; small equipment such as hoovers, microwave ovens and toasters; and small IT and telecommunications equipment such as mobile phones, GPS devices, calculators, printers, telephones, routers and smartphones. Therefore, waste from digital equipment is mainly in the form of screens and small IT and telecommunications equipment.
Of the 62 Mt of WEEE generated worldwide in 2022, 5.9 Mt came from monitors, tablets, laptops and televisions, and 4.9 Mt came from small IT and telecommunications equipment. Between 2019 and 2022, the generation of waste in these two categories has slighlty evolved in two different direction: the annual generation of waste from screens, tablets, computers and televisions decreased by 12% compared to 2019, while that of small IT equipment increased by 4% for the same period. However, these values do not evolve in the same way between the different regions of the world. Europe produces the highest weight of e-waste per capita, far ahead of Africa and Asia, although the latter produces a large volume of waste, notably due to its larger population. However, Europe is the region with the highest e-waste collection rate thanks to relatively effective national and European policies. Globally, out of 62Mt Mt of e-waste, 48.2 Mt is undocumented and usually ends up buried, traded or recycled outside existing environmental standards. However, the value of recoverable raw materials remains very high. Tthe metals contained in the 62 million tonnes of e-waste generated worldwide in 2022 (including iron, copper and aluminium) are estimated to be worth approximately US$91 billion.
Given the phenomenal flow of E-waste being produced and untracked each year, significant pollution is occurring in the countries where this waste is stored and buried. It is estimated that 50 tonnes of mercury escape from landfilled e-waste every year, as well as 71 kt of flame retardant plastics (FRP), which are extremely toxic to the living environment and to the people exposed to them. Informal landfills and recycling sites therefore present significant health and environmental risks. Toxic substances leaking from the oxidation of electronic components pollute soils and waterways, affecting animals, plantations and fish that will be consumed by the surrounding communities. Informal recyclers risk breathing toxic fumes from burning wires and circuit boards. These workers unintentionally put themselves at greater risk of injury as well as genetic damage, blood glucose imbalances, effects on liver function, and fertility disorders.
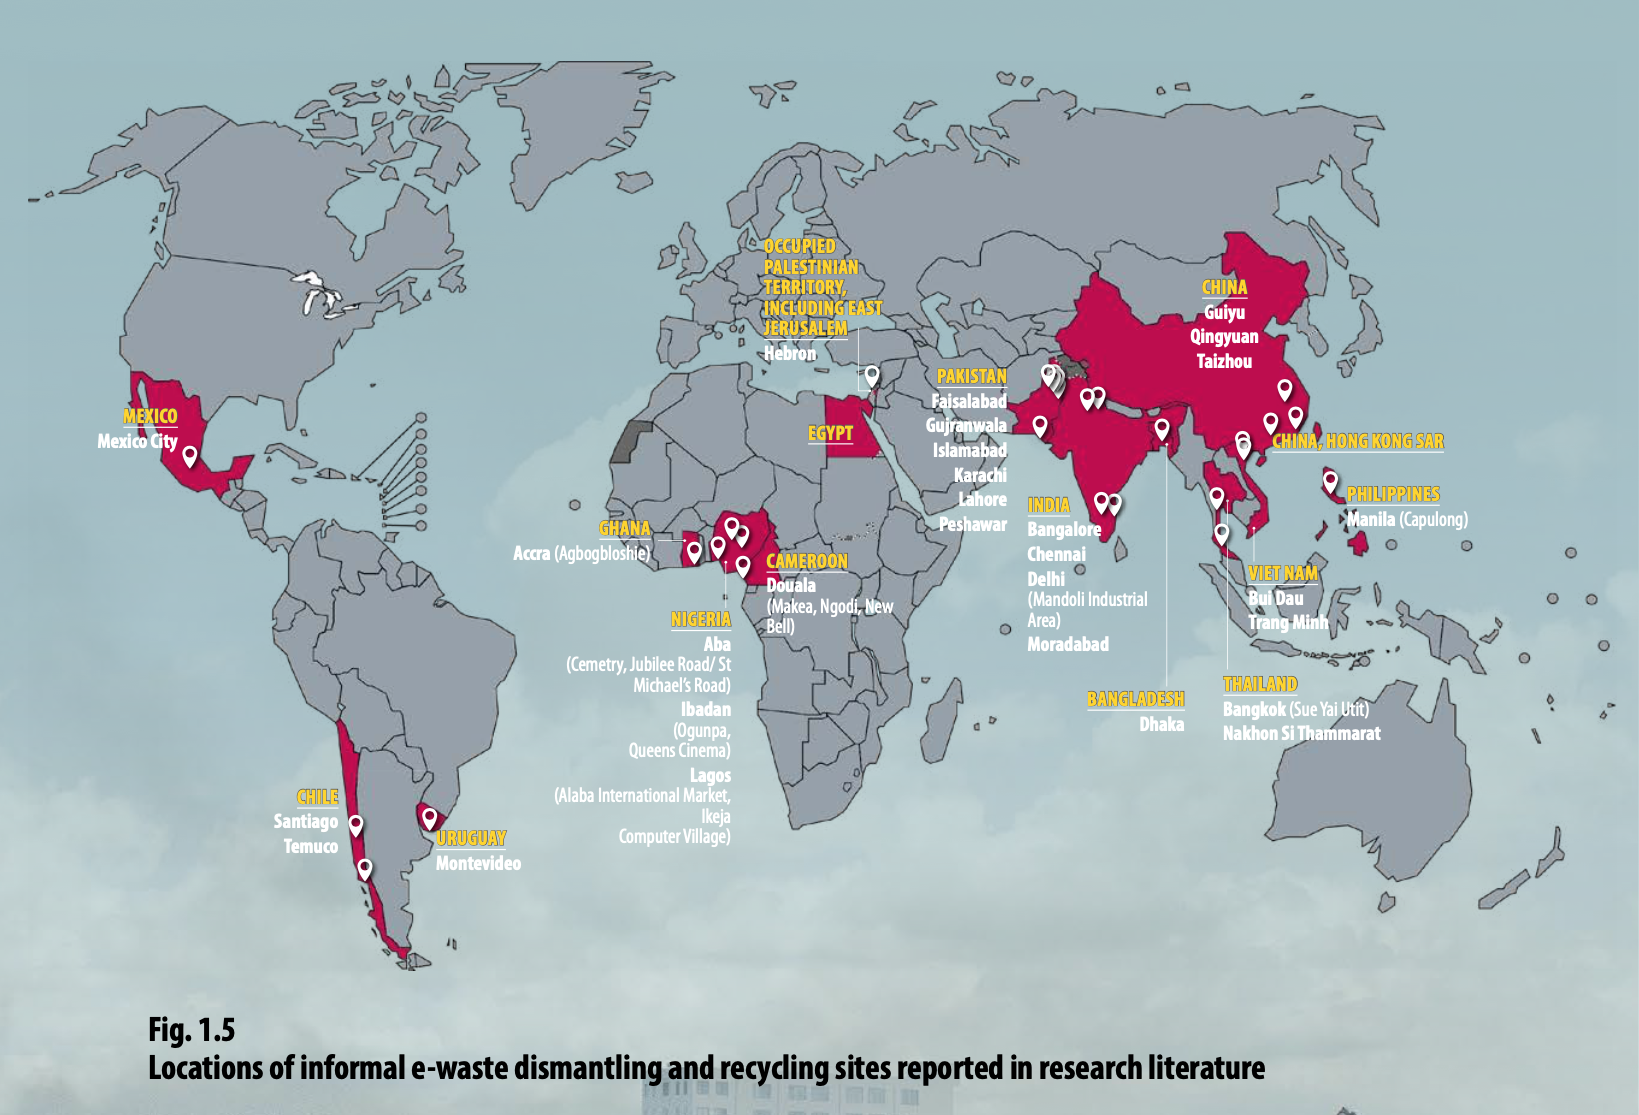
One solution often put forward to address the environmental challenges of the digital value chain is better end-of-life management through repairing, refurbishing or recycling. However, there are many challenges throughout the end-of-life process that make it difficult, and sometimes impossible, to implement these practices on a large scale.
Obsolescence
Digital equipment have a particularly short lifespan wich puts pressure on the ICT industry’s downstream value chain. This is partially due to several types of obsolescence.

Repair/Refurbish
In order to extend the lifespan of digital equipment, repairing and refurbishing practices are essential. However, these activities, even if beneficial from an environmental point of view, have their own impacts.
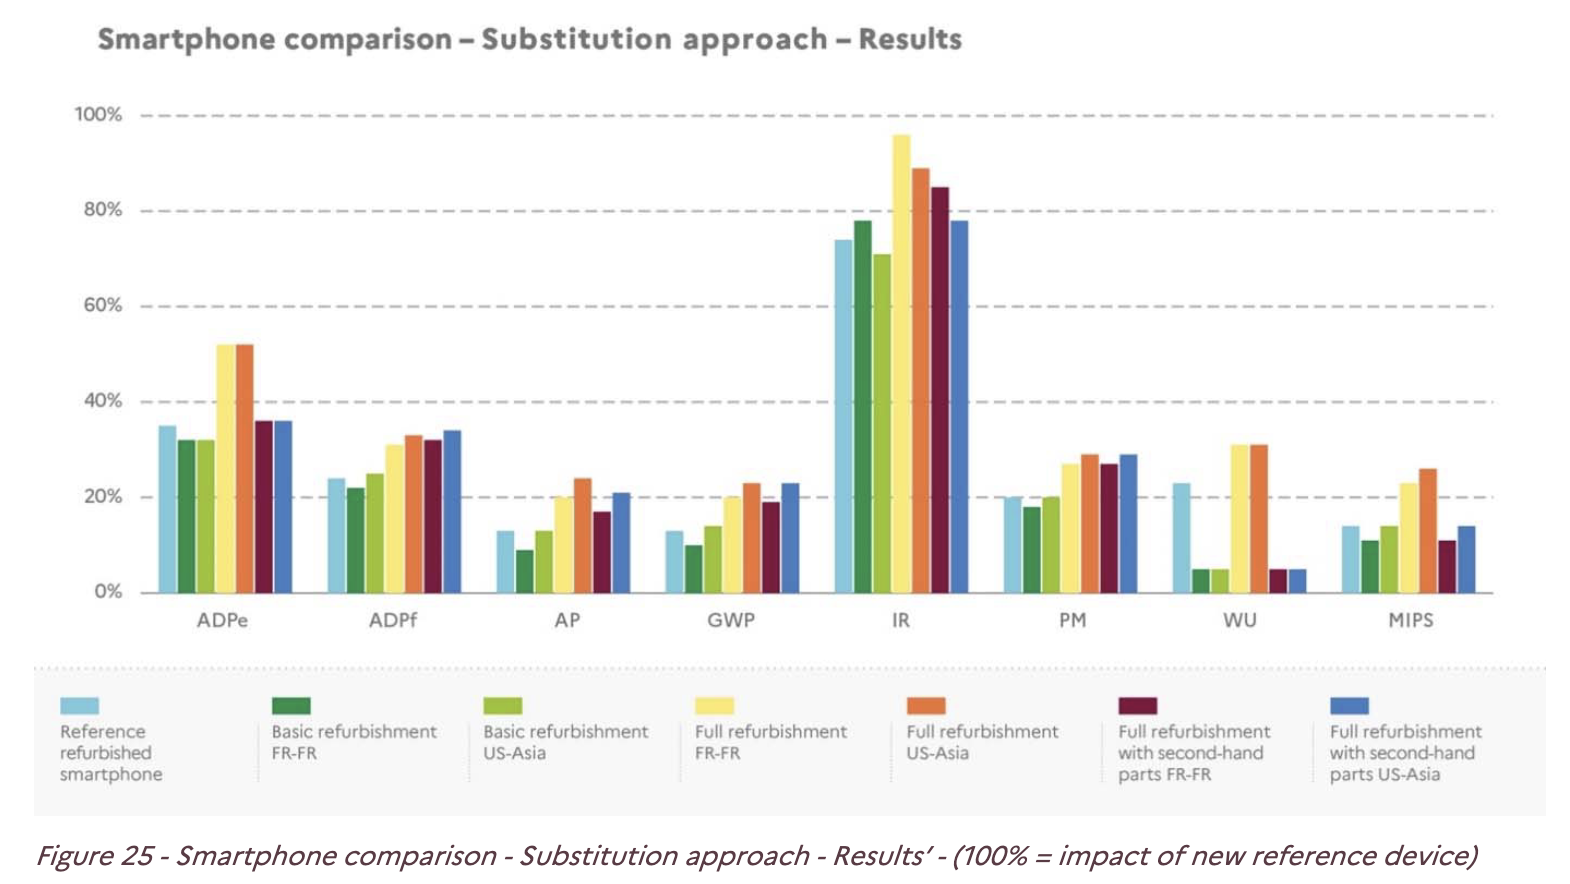
In addition, these practices depend on the availability of parts, which in turn depends on manufacturer policy. Furthermore, given that many manufacturers release a wide range of products at high deployment rates, it is difficult to industrialise repair and refurbishment practices, which often limits their large-scale implementation. The sector is also very heterogeneous, with small social economy actors competing with multinationals. Competition for deposits and industrialisation is becoming increasingly difficult for smaller players.
Recycle
In the face of constant increases in material consumption, recycling electronic waste seems to be a promising option. In Europe, recycling is promoted as a means of addressing environmental and sovereignty issues, but its effectiveness depends heavily on the type of metals involved. With the exception of structural metals such as aluminium and copper, metals used in digital technology are rarely recycled.
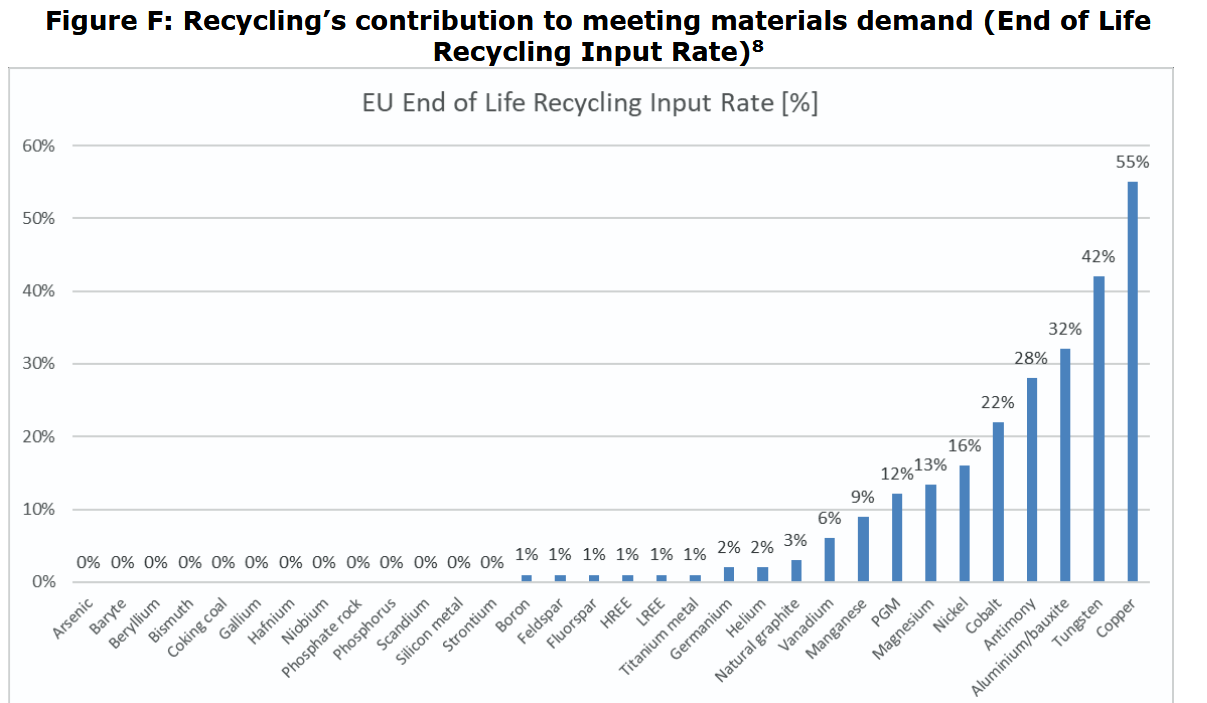
Indeed, it is difficult to recover and recycle the metals present in digital equipment because they are present in such small quantities, or because they are used in an alloy that cannot be separated.
In addition to these technical constraints, there are also economic ones. Recycling industries have to invest much more than other industries to recover metals. Florian Fizaine cites the example of the UMICORE company: One billion dollars has been invested in the company’s recycling and refining plant in Belgium. This plant extracts 30 tonnes of gold, 37 tonnes of platinum group metals, 1,000 tonnes of silver, and 68,500 tonnes of other metals per year from scrap. This makes it the third largest gold mine in the world […] By comparison, a paper recycling plant only requires an investment of 30 to 50 million dollars“ (France Stratégie).
Without collection and treatment, electronic waste is generally sent through informal or illegal channels to countries in Africa, South America or South East Asia. The metals and materials they contain are then extracted in conditions that are dangerous for human health and ecosystems. Today, it is estimated that 80% of electronic waste goes through informal channels.
If illegal disposal is subject to important social and environnmental dommages, legal pathways are also subject to environnmental controveries.
Important
Related case study : Umicore’s Hoboken site
Without collection and treatment, electronic waste is generally sent through informal or illegal channels to countries in Africa, South America or South East Asia. The metals and materials they contain are then extracted in conditions that are dangerous for human health and ecosystems. Today, it is estimated that 80% of electronic waste goes through informal channels.
The limits of recycling in the context of growth.

The increased use of digital technologies in products not designed for resource recovery puts pressure on critical metals. The recovery of these metals through recycling is now extremely limited, except for a few high-value metals such as gold and platinum. Ultimately, recycling cannot be considered a viable solution for meeting increased demand.
Reference
- https://www.itu.int/en/ITU-D/Environment/Documents/Publications/2025/d-gen-e_waste.01-2024-pdf-f.pdf
Session 8 : Environmental footprint of ICT
Tip
This session parlty uses the research paper from Gauthier Roussilhe, Anne-Laure Ligozat and Sophie Quinton, titled: A long road ahead: a review of the state of knowledge of the environmental effects of digitization (2023) (Link)
A key difference
For the purpose of environmental analysis of the digital sector, it is customary to divide it into three technical parts: data centers, networks and user equipment. In addition, there is a services perimeter: with a few exceptions, any digital service needs data centers, telecommunication networks and IT equipment to function. Separately, we look at other sectors (transport, energy, industry, etc.) to estimate the indirect effects of digitization (rebound effect, substitution, etc. leading to avoided or added impacts) without really imposing an official method. .
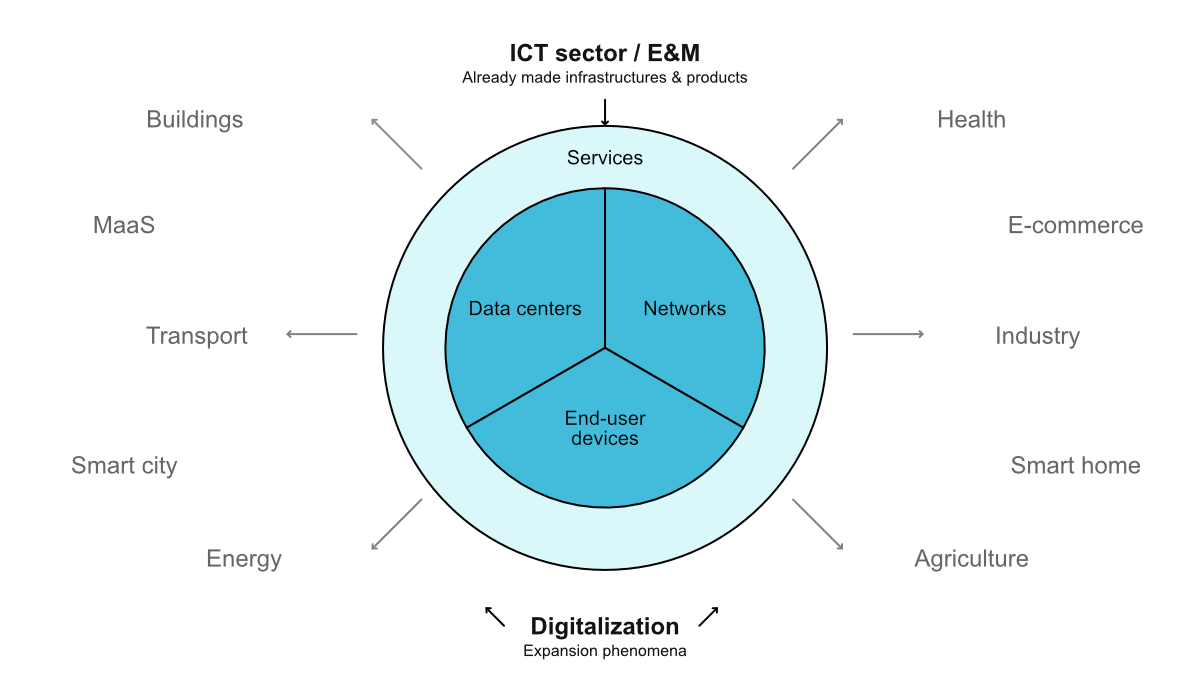
What is an environmental footprint?
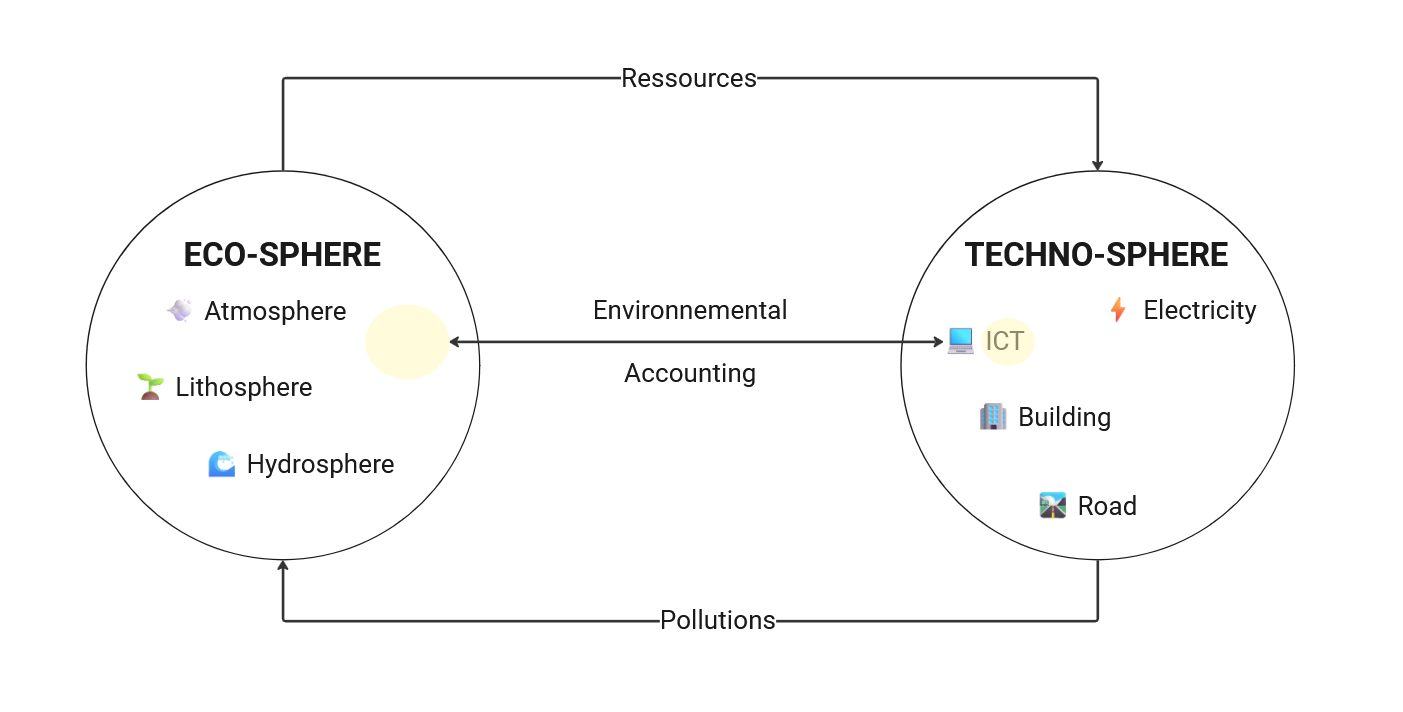
Environmental impacts are physical phenomena taking place within the biosphere. They can be localized to particular areas (land use, air pollution, etc.) or global (contribution to global warming, depletion of abiotic resources, etc.). These environmental impacts can be assessed using physical measuring instruments (with a carbon dioxide sensor, for example). This is the case for soil, air or water pollution, when directly measured on ecosystems. These impact measurements enable us to understand past and present environmental and physical constraints.
However, by characterizing only phenomena that take place inside the biosphere, they make it difficult to manage consumption, production or public policies, which are socio-economic phenomena that take place within the technosphere.
The biosphere corresponds to all terrestrial ecosystems present on the lithosphere (earth), atmosphere (air) and hydrosphere (sea). The technosphere corresponds to the part of the biosphere modified by human activities.
This is where environmental accounting comes in. It makes it possible to match socio-economic realities (a product, a service, a unit of currency, an action, a policy, etc.) with a physical materiality characterized by environmental impacts.
This materiality is expressed in physical units: kgCO2eq. for contribution to global warming, m3 for water depletion or kg for land transformation (see PEF1). This suggests that the values produced by environmental accounting are of the same nature as those produced by physical measuring instruments such as a CO2 sensor, a graduated container to evaluate m3 or a weighing scale to evaluate kg.
However, when used in the context of environmental accounting, these units are intended to describe not only physical realities, but also socio-economic ones. Indeed, associating environmental impacts with socio-economic realities is not a neutral approach, but rather one of accounting that follows established technical rules that are part of modeling paradigms (logical and political principles). It is these principles that define the way in which human activities in the technosphere and environmental impacts in the biosphere are linked.
Environmental footprint in the digital sector
In environmental studies, the digital sector is divided into three areas: data centres, telecommunications networks and user equipment. This division is now the consensus of the scientific community and also meets the modelling objectives of international standards for studying the life cycle of a system, a service or a product. These standards are ISO 14040 and 140441 and specifically the ITU L.1410 standard (ETSI 203 199) developed in part by the industry.
Describing all the environmental impacts related to the production of digital infrastructure (manufacture of servers, antennas, equipment, etc.), its use and its end of life, is a complex exercise that varies greatly depending on the equipment, the production methods and the territories concerned. This description of impacts can only be accurate if it focuses on equipment production and use at an explicitly defined scale. For example, what are the environmental impacts associated with the production, use and end-of-life of a smartphone?
The digital infrastructure has multiple impacts on ecosystems: use of fresh water, extraction of minerals in fragile ecosystems, soil pollution, landfill pollution from equipment, greenhouse gas emissions, etc. One indicator in particular is attracting attention today because it corresponds to the transition objectives set by national and international institutions: greenhouse gas emissions. These gases are generally emitted in the production of IT equipment (fuel oil for extraction and transport, energy to run industrial production lines, foundries, etc.) and in the production of the energy needed to run this equipment (electricity production). Greenhouse gas emissions are therefore directly related to the energy consumption of the digital infrastructure, i.e. the manufacture and use of equipment. However, despite the focus on greenhouse gas emissions and thus energy consumption, other major impacts of digital infrastructure should not be overlooked: consumption of metals and other associated resources, water consumption, ecosystem degradation and pollution. In order to have the clearest possible picture of the environmental footprint of digital technology, it is necessary to use all these criteria and to study them with a globally shared methodology. That’s the purpose of a life cycle assessment (LCA).
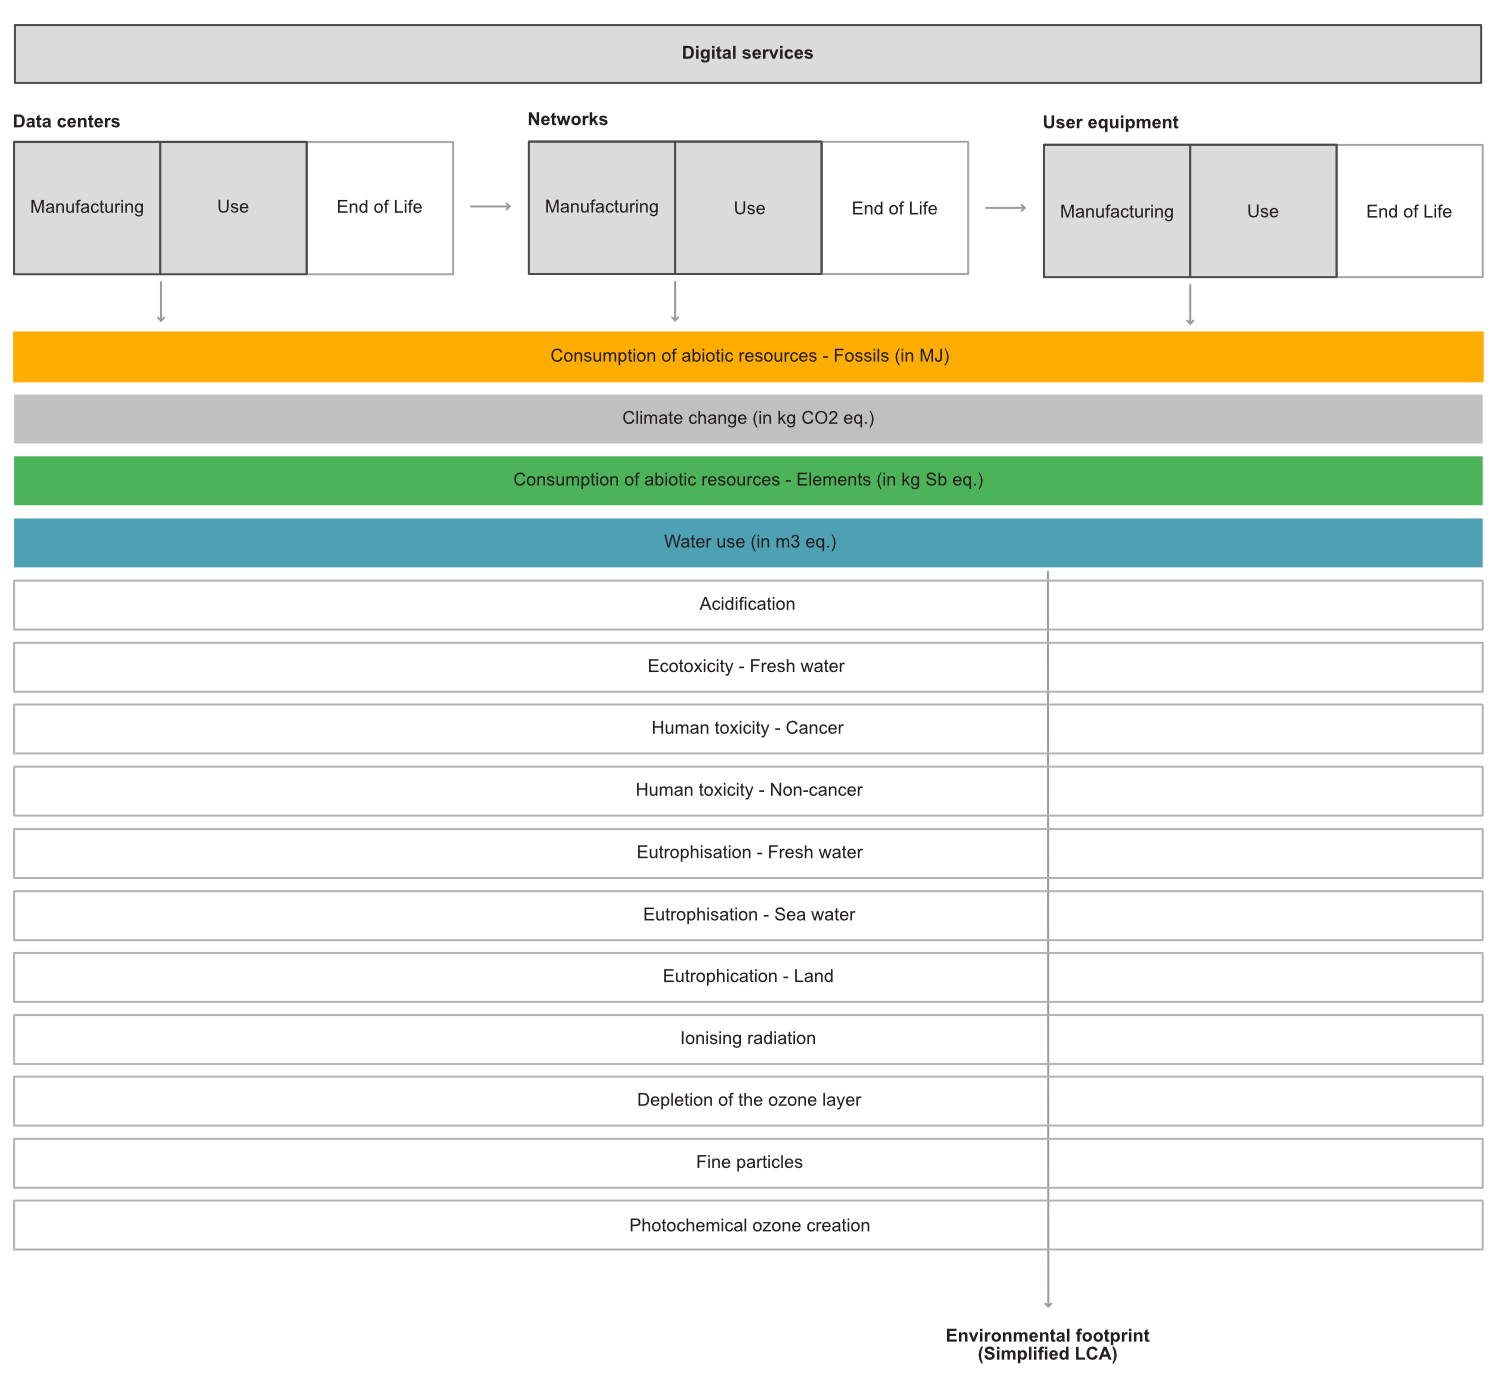
Environmental footprint of a simplified LCA for a digital service
Today, we have relatively little data on the entire life cycle of digital products and infrastructure, especially on manufacturing and end-of-life. In fact, the environmental footprint is limited to four environmental factors, whereas the European Union recommends 20 in its environmental analysis standards.
Let us take a look at current practices, from assessing the impact of physical equipment to evaluating services and territorial estimates.
_](img/Pasted image 20251019184547.png)
Environmental footprint of a hardware equipment
ETUDE DE CAS GPU
Other exemples
Here are some examples of environmental assessments of equipment :
Environmental footprint of a service
ACTIVITE MAIL
Exemples
Here are some examples of environmental assessments :
- LCA of paper based vs. digital based commercials
- LCA of Tribal: a messaging app.
- LCA of Irocco, an email service provider
Territorial estimates
Territorial estimates
So far, most global assessments of the direct environmental effects of ICT have focused on electricity consumption and greenhouse gas (GHG) emissions – also called carbon footprint – leaving out other major effects such as material or water footprint, but also pollutions. The most prominent publications are: Andrae & Edler (2015, 2020), Malmodin & Lunden (2018), Belkhir & Elmeligi (2018) and Freitag et al. (2021). Carbon footprint estimates and projections are computed using a mix of top-down views based on global numbers (worldwide data traffic, hardware shipments, etc.) and bottom-up estimates obtained mostly using life cycle assessments (LCAs). By unifying the scopes considered in the main global estimates, Freitag et al. argued that GHG emissions from the ICT sector ranged from 2.1 to 3.9% of global emissions in 2020 (1.2 to 2.2 GtCO2e). This wide range is explained by different assumptions about the evolution of energy efficiency and ICT decarbonization, but also by the uncertainty surrounding used data sets due to the obfuscation of large parts of the ICT sector’s production and supply chains.
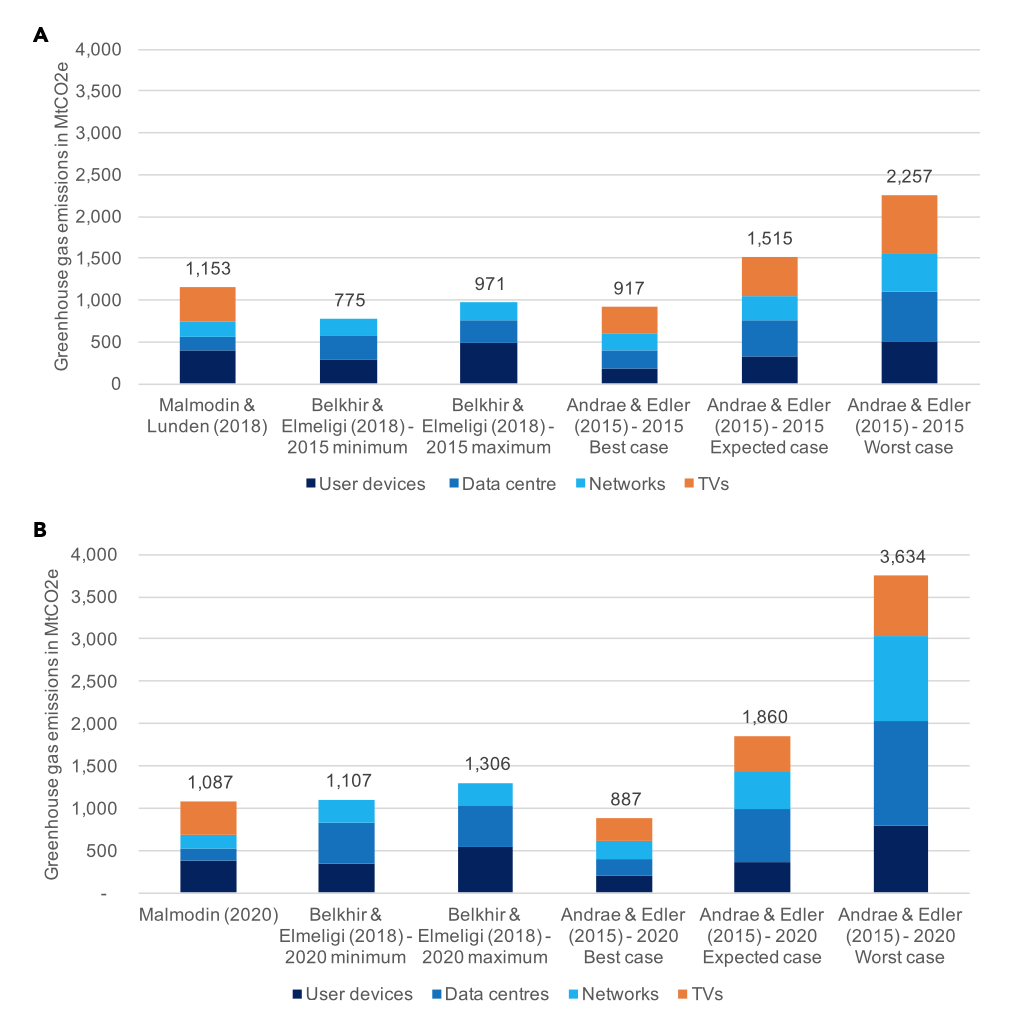
Summary of global estimates in 2015(a) and 2020 (b) - Credits: Freitag et al., 2021
There is a lack of agreement about which technologies ought to be included in calculations of ICT’s GHG emissions—particularly TV. All studies include data centers, net- works, and user devices as the three main components of ICT, but there are pronounced differences of opinion regarding the proportional impact of each. A comparison of the different pro- portions in 2020 estimates (excluding TV) is provided below (Freitag et al. 2021)
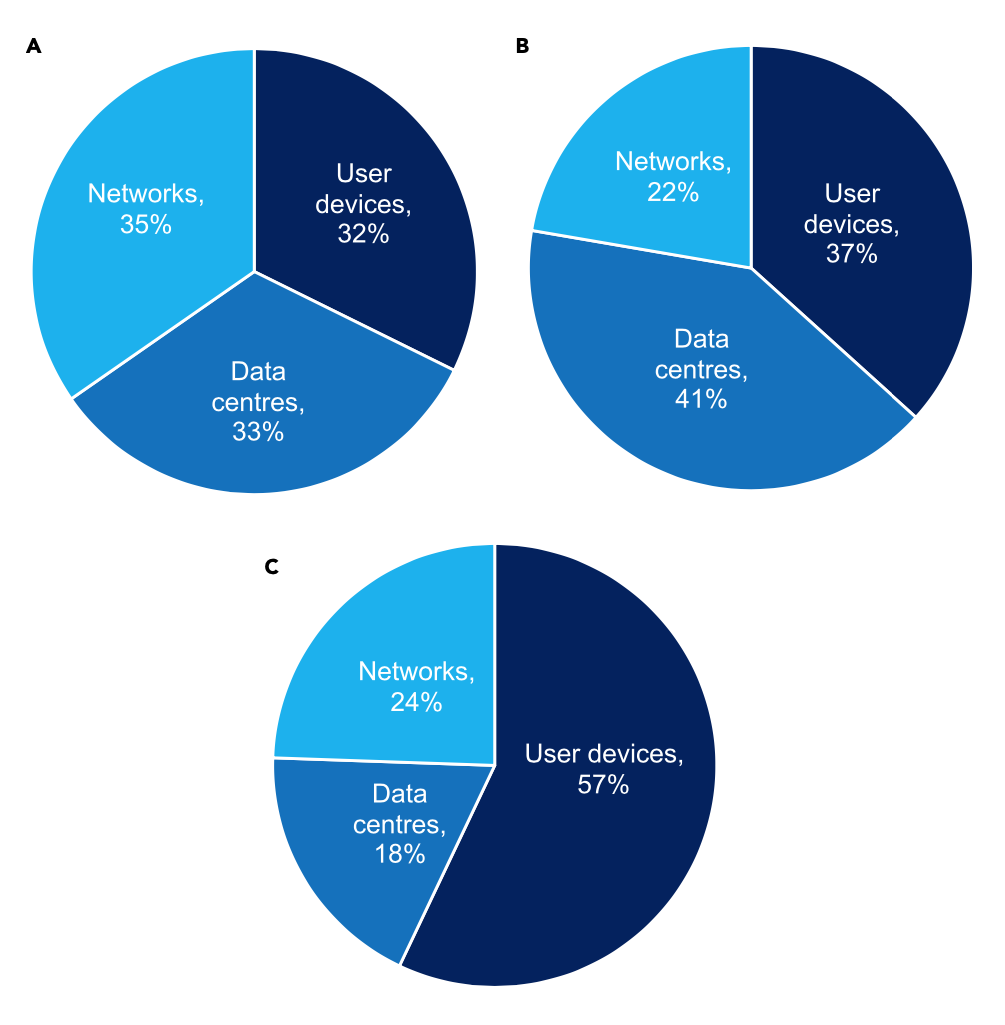
Proportional breakdown of ICT’s carbon footprint, excluding TV (A) Andrae and Edler (2015): 2020 best case (total of 623 MtCO2e), (B) Belkhir and Elmeligi (2018): 2020 average (total of 1,207 MtCO2e), (C). Malmodin (2020): 2020 estimate (total of 690 MtCO2e) - Credits: Freitag et al., 2021
In UE (2020)
Total electricity consumption for digital services in Europe is 283 TWh out of a total of 3,054 TWh6, which means that electricity consumption for digital services during the use phase accounts for 9.3% of European electricity consumption. Total GHG emissions for digital services in Europe are 185 Mt CO2 eq. out of a total of 4,378 Mt CO2 eq.7, which means that GHG emissions from digital services account for 4.2% of European GHG emissions. (GreenIT, Digital Technologies in Europe: an environmental life cycle approach, pp. 8-9)
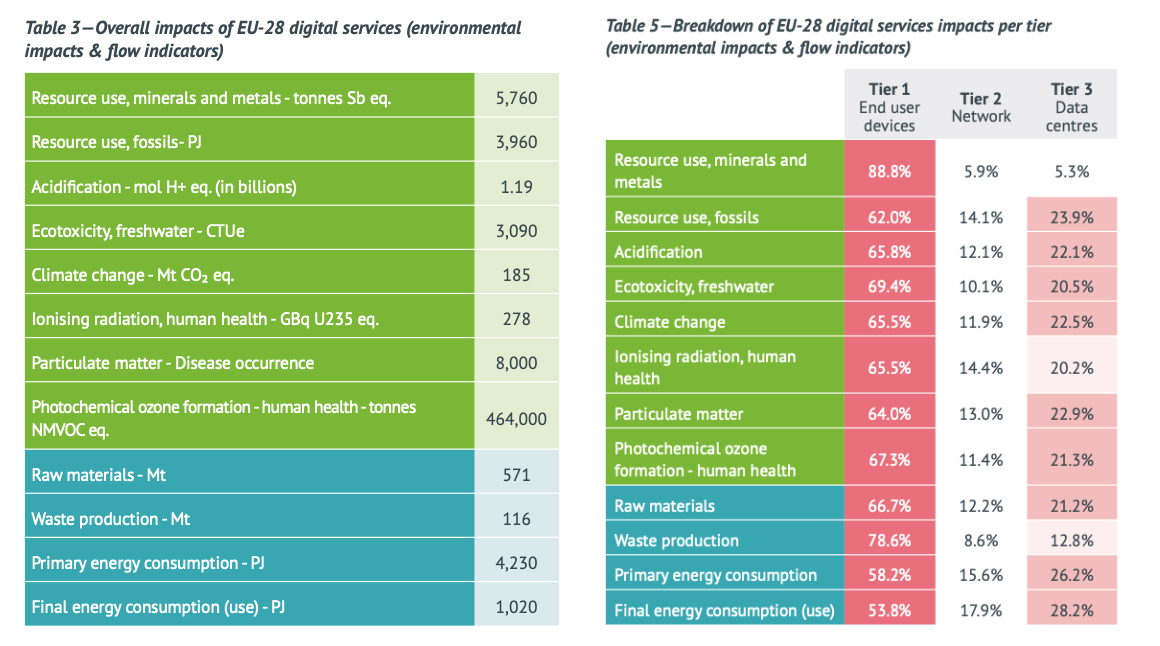
_Overall impacts and breakdown per tier of ICT services in UE - Credits: [Bordage et al. 2021](https://www.greenit.fr/wp-content/uploads/2021/12/EU-Study-LCA-7-DEC-EN.pdf)_
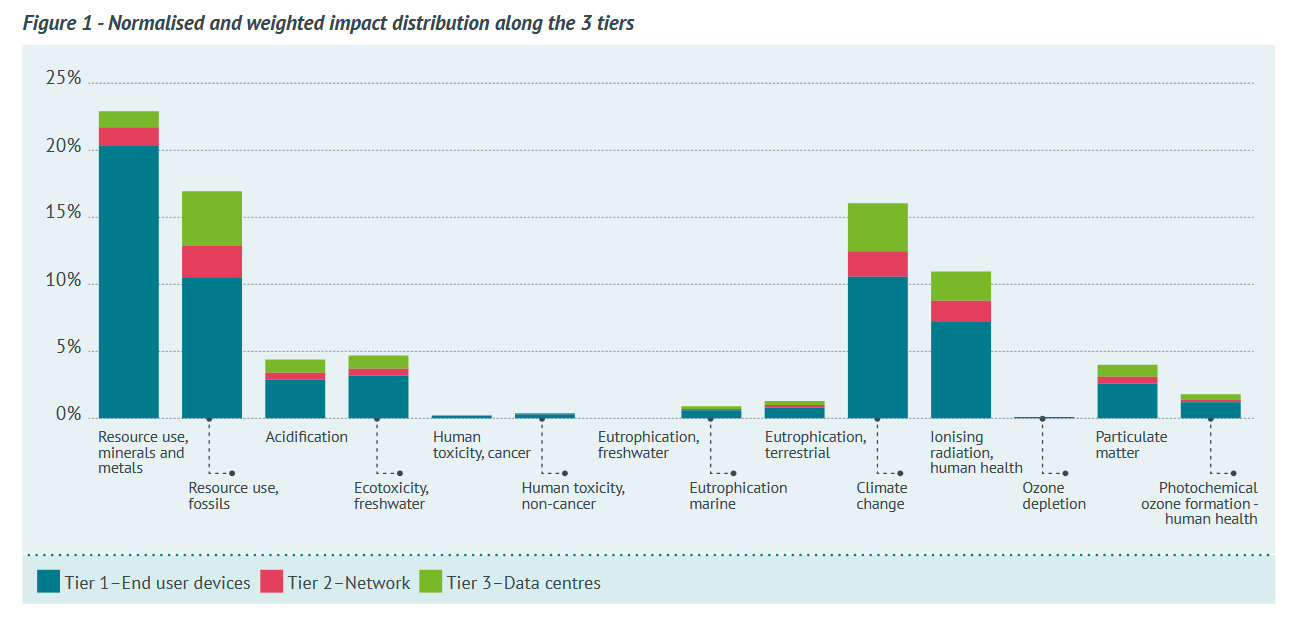 _Normalised and weighted impacts and breakdown per tier of ICT services in UE - Credits: [Bordage et al. 2021](https://www.greenit.fr/wp-content/uploads/2021/12/EU-Study-LCA-7-DEC-EN.pdf)_
In France
The ADEME-Arcep study assessing the environmental impact of digital technology in France, published in 2022, estimates emissions linked to this sector at 17.2 million tons of CO2 equivalent, or 2.5% of France’s emissions in 2020. However, this study had a significant limitation in that it did not take into account data centers located abroad that host French users. In addition, various studies on digital technology have since been carried out, making it possible to update or refine the environmental assessment of certain digital components, particularly telecommunications networks and audiovisual uses.
This document therefore aims to incorporate these various elements in order to assess the environmental footprint of digital technology in France in 2022, and presents three main updates compared to the ADEME-Arcep study for 2020: the inclusion of data centers located abroad, the update of the distribution of televisions (in favor of larger OLED screens, which have a greater impact), and the integration of the results of the study on the footprint of internet access provision in France.

Future trends
It is agreed that low-carbon transition operational scenarios should not be projected more than ten years ahead, as there are too many uncertainties regarding, among other things, the evolution of climate conditions or the evolution of the price of low-carbon technologies. The same applies to the digital sector, where it is difficult to predict the future equipment and efficiency of the equipment, or the emergence of new uses that are not yet known. Thus, Andrae and Malmodin project their estimates up to 2030. For some unknown reason, Belkhir projects his results to 2040, but the uncertainty, both climate-wise and technology-wise, in twenty years’ time disqualifies this estimate from the outset.
This uncertainty leads to a second methodological point: it is extremely risky to project the evolution of the sector based on historical data. As mentioned earlier, digital equipment and services are rapidly becoming more efficient at the moment, so it is not possible to estimate that their past footprint will evolve consistently. This goes in two directions: the relative power consumption (kWh or J / per operation) of a piece of equipment tends to decrease over time and does not remain constant over time. On the other hand, more complex or more efficient equipment can lead to an increase in the material footprint (manufacturing impacts). There are of course all the new uses that are not yet well modelled from an environmental point of view: AI, machine learning, IoT, blockchain, VR/AR, cloud gaming (Google Stadia, etc), etc.
Andrae estimates that the digital sector will account for 1,500 to 3,200 TWh of electricity consumption and 1,269 MtCO2e of emissions by 2030 (Freitag et al., 2021). Other researchers haven’t proposed other estimates yet, but some expect that efficiency gains and substitution would allow the carbon footprint of the digital sector could be halved by 2030.
Charlotte Freitag’s Lancaster team has summarised the various hypotheses in the scientific literature that may change the environmental footprint of the sector in the years to come:
- Efficiency gains continue steadily ;
- Renewable energy is increasingly replacing fossil fuels in the mix of large digital companies;
- Slowing efficiency gains reduce the growth of the sector and thus the growth of its emissions ;
- Activation effects of digitalization (enablement effect) reduce the overall emissions of other sectors ;
- Increasing mutualisation of IT infrastructure (hyperscale, etc.) ;
- Market saturation in terms of facilities and services ;
- Reducing the weight of new equipment.
Among the assumptions that consider negative trends in the digital sector :
- Exponential growth of data is increasing the energy consumption of networks and data centres (growing infrastructure) despite efficiency gains ;
- Emergence of new equipment-intensive (IoT) and data-intensive (cloud gaming, etc.) services ;
- Efficiency gains are slowing down ;
- Rebound effects counterbalance efficiency gains at the aggregate level ;
- Efficiency gains through digitalization support the development of the sector and therefore its footprint ;
- Efficiency gains from digitalization increase the economic activity of other sectors and thus their environmental footprint ;
- Increasing the material intensity of new equipment.
In an unprecedented foresight exercise, the French Agency for Ecological Transition and the French Telecoms Regulator have attempted to project the environmental footprint of the digital sector in France in 2023 and 2050 using 4 scenarios. Estimates for 2050 are not recommended, but the median scenario for 2030 projects a 45% increase in the carbon footprint in 10 years.
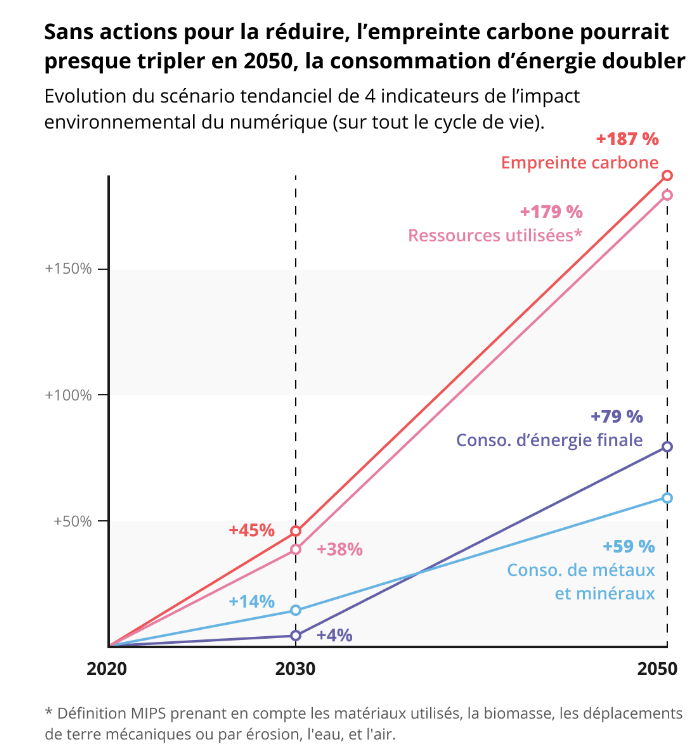
Trends in 4 indicators of the environmental impact of the digital sector. - Credits: Lees Perasso et al. 2022
Moving forward in the dark
Environmental assessment is a challenging exercise, particularly in the digital sector. It faces a lack of transparency from industry players, significant uncertainty and accounting issues that are the subject of technical but also political debate.
During the last six sessions, we have discussed material dynamics of the ICT sector and the associated environmental issues. It seems more important to understand these than to try to find exact environmental footprint figures. For now, all the evidence suggests that the footprint is increasing year-on-year, albeit not at the exponential rate predicted by some researchers. However, the development of AI systems could lead to exponential growth; it is still too early to tell.
Resources
Syllabus
- Gauthier Roussilhe et al., A long road ahead: a review of the state of knowledge of the environmental effects of digitization, 2023
- Charlotte Freitag et al., The real climate and transformative impact of ICT: A critique of estimates, trends, and regulations, 2021 (Summary + Introduction)
To go further
- Frederic Bordage et al., Digital technologies in Europe: an environmental life cycle approach, 2021
- Etienne Lees Perasso et al., Evaluation de l’impact environnemental du numérique en France et analyse prospective, 2022
- Udit Gupta et al., Chasing Carbon: The Elusive Environmental Footprint of Computing, 2021
- Steffen Lange et al., Digitalization and energy consumption. Does ICT reduce energy demand?, 2020
Session 9 - Modelling indirect effects of digitalisation
Digital systems have profoundly changed activities in post-industrial societies. Yet, it is hard to assess if these changes have been beneficial regarding climate pledges and planetary limits. Estimating those effects on systems and activites and ways of life, is at the heart of numerous debates around the overall environmental footprint of digitalization. Do the positive effects outweigh the negative effects, and if so, how and under what conditions?
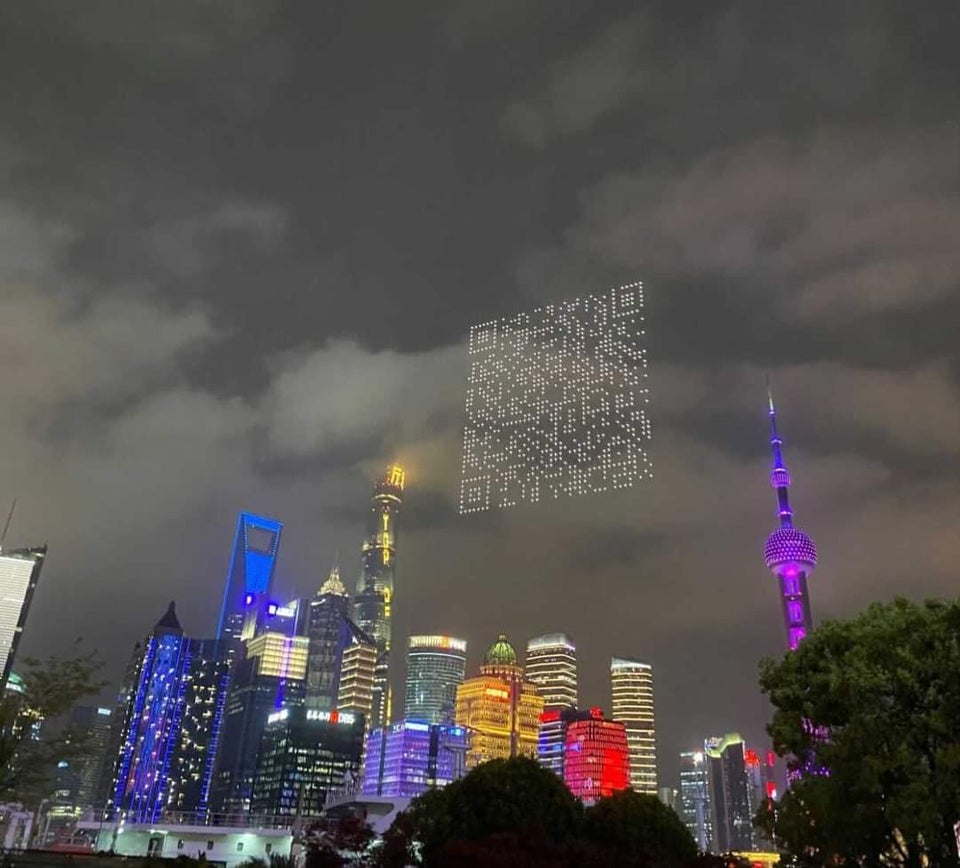
A floating QR code in Shanghai
Is digitisation helping the ecological transition?
It is widely accepted that digitisation is helping the ecological transition, and this idea is shared by public institutions, the private sector and even a large proportion of citizens in many countries. Because even if the digital sector has a lower environmental footprint, we need to know whether digitisation is helping other sectors to decarbonise and adapt. This involves comparing the footprint created by the digital sector with what it avoids or removes in other sectors. We mainly look at the greenhouse gas emissions avoided in other sectors, which can be called scope 4, handprint or avoided emissions.
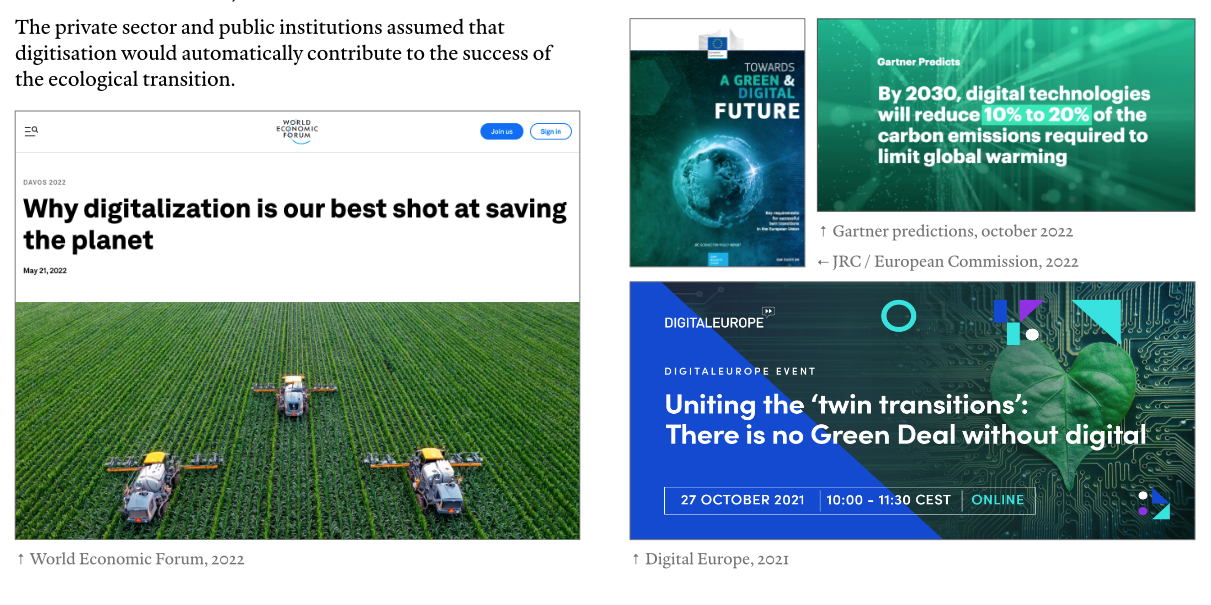
A selection of claims on the positive impacts of digitalisation for transition policies
Today, there is an effort to improve the methodology for defining avoided emissions, thanks in particular to digitisation. These include the ITU-T L.1480 standard, the European EGDC methodology (under construction) and Carbone 4’s Net-Zero Initiative for IT. These documents have come to light because the way in which avoided emissions are defined has so far been very confused, leading sometimes to false claims.
Because ecological transition policies are still largely underfunded, estimating avoided emissions is now of strategic interest, as proving that one is helping to decarbonise other sectors will give access to preferential financing and attract new investment. It is therefore necessary to review the foundations of these methods and past experience.
Taxonomies
If we talk about the environmental footprint of a digital system as a direct effect, then we talk about the effects of that system in the activities or processes where it is deployed as an indirect effect. However, there are different types of indirect effect levels, both positive and negative. In a 2016 paper, Horner et al. summarise the existing taxonomies and propose a new one. The direct, or first order, effects are those related to the manufacture, use and end-of-life of digital systems. Indirect, or “single-service” or second-order effects are the efficiency or substitution gains related to the digital service deployed. This can also include a direct rebound effect (I consume more of a service because it is more efficient/cheaper). Indirect, or third order, effects include indirect rebound effects (I consume less on the more efficient service, so I consume elsewhere), economy-wide effects, and systemic transformations. Horner et al. provide good examples of each of these categories with a GPS system. Today, the general taxonomy is more or less fixed but the main problem is to model these effects.
| Scope | Effect | Example (from Horner) | Related methods |
|---|---|---|---|
| Direct / First order | Embodied footprint | Energy, materials and resources to produce a GPS system | Life cycle assessment |
| Operational footprint | Energy, materials and resources to operate a GPS system | ||
| Disposal footprint | Energy, materials and resources to dispose of a GPS system at end-of-life | ||
| Borderline case | Induction | Equipement induced by the use of GPS system (satellites, etc.) – can be also considered as direct effects or rebound effect | Mixed |
| Indirect / Second order | Efficiency / Optimization | More efficient traffic flow due to GPS-enhanced routing | Enablement / Avoided emissions framework |
| Substitution | Replacement of paper-based maps | ||
| Direct rebound | More travel due to lower cost of traffic congestion | Rebound Effect | |
| Indirect / Third order | Indirect rebound | Footprint consumed during time saved by efficient travel | |
| Economy-wide rebound (Structural change) | GPS enables autonomous vehicles and causes growth of intelligent transportation system manufacturing | ||
| Systemic Transformation | Autonomous vehicles alter patterns in where people choose to live and work |
Current issues
Faced with the lack of consistent and credible methodology, Coroama et al. proposed a methodology to assess the environmental effects induced by ICT services, from the perspective of a single service, and Bergmak et al. from the perspective of multiples services and companies. They address the main issues met so far:
- substituting versus optimizing ICT services ;
- the time perspective ;
- the choice of the baseline ;
- the extrapolation method and rebound effects.
Similarly, Rasoldier et al. point out that existing literature tends to ignore:
- life-cycle impacts, i.e. the environmental footprint of the ICT service/product studied ;
- structural impacts (rebound effects, society-wide effects).
Overall, the issues faced with the existing literature is the focus on positive effects, while ignoring or minimizing possible negative outcomes. Extrapolating case studies leads to several shortcomings pinpointed by Malmodin and Coroama:
- the success and failure of ICT services depend of factors outside of the ICT sector (policies, price, culture, etc.) that are generally overlooked ;
- the environmental impact of the ICT service studied is not considered ;
- the representativeness of case studies is critical but rarely discussed, especially if extrapolated.
Court and Sorrell looked more closely at the digitization of goods to assess their influence on energy consumption and carbon emissions. Out of 31 studies based on life-cycle analysis, authors show a great variability of estimated energy savings, from -90% to +3000% for e-publications for instance, pointing to the importance of key assumptions. They conclude that a narrow scope leads to overly optimistic results as most studies assume complete substitution of material goods by digital goods, and don’t account for rebound effect. They note that studies with a larger scope don’t show large energy savings and can present an increased energy consumption.
Furthermore, the expected benefits could be negligible compared to the transformation effort needed and some solutions could interact negatively: for instance, according to Coulombel et al., improving public transit infrastructures and developing carpooling services in the same area can be counterproductive.
Efficiency, substitution: indirect effects of a service
In many ways digital services can make activities more efficient from an industrial or managerial point of view. For example, a GPS navigation system usually allows for shorter or shorter journeys in relation to road traffic. This is particularly effective with complex road systems and high travel intensity activities such as road freight. Similarly, digital services can replace other products, services or activities. For example, video conferencing can replace a car or plane journey to a conference/seminar. A digital application such as Google Maps or OpenstreetMaps can replace a dedicated GPS that comes with its own software. Generally, if we focus on the narrow scope of the digitised activity, we can estimate efficiency and/or substitution effects. Estimates from industry are generally focused on this perimeter only.
According to the systematic literature review performed by Bieser and Hilty the most common application domains of ICT are virtual mobility, virtual goods and smart transport.
The ITU-T L.1480 standard proposes to define the indirect effects of a digital service using a consequence tree as shown below.
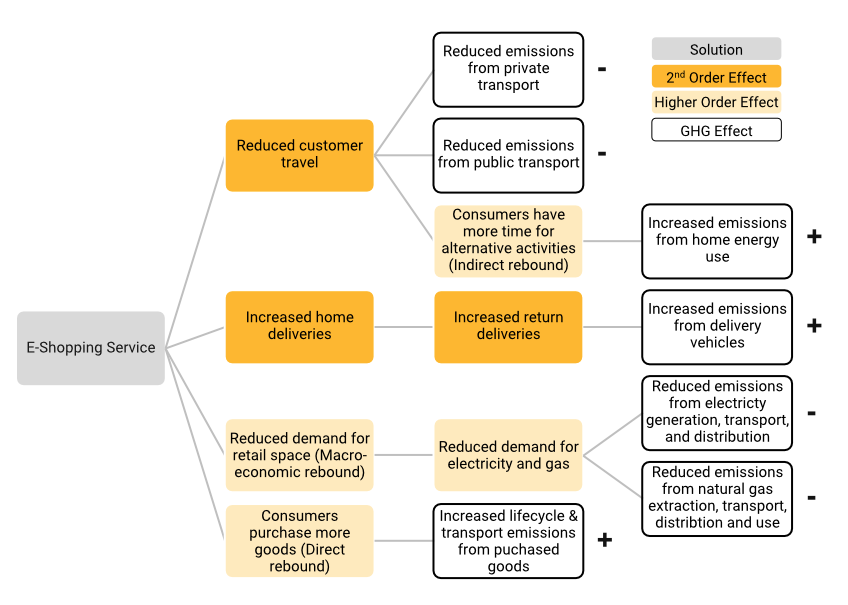
Consequence tree of a e-shopping service - Credits: ITU
Estimating avoided emissions involves comparing two scenarios: a reference scenario in which the digital service is not introduced, and a scenario in which it is. The definition of the reference scenario is crucial, because if it is overestimated, then the emissions avoided will also be overestimated, and vice versa.
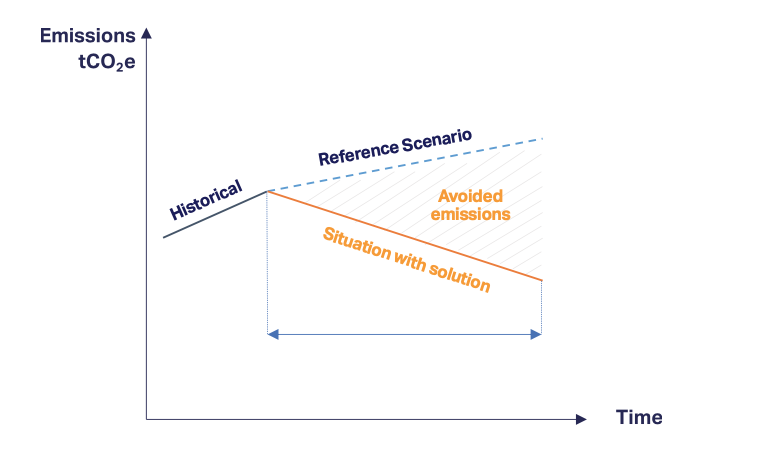
Historical and reference scenario VS scenario with a new solution - Credits: WBCSD
When quantifying the avoided emissions impact of their solutions, companies should follow the step-by- step approach below and ensure that the calculations rules detailed in the guidance are followed to achieve a robust and consistent approach (WBCSD).
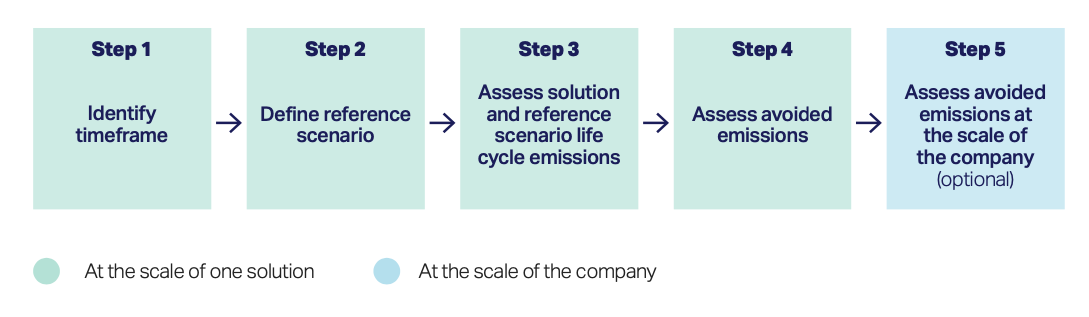
The five steps to ensuring a consistent approach to assessing avoided emissions - Credits: WBCSD
Looking at the historical assumptions in the digital sector
Since the early 2000s, many organisations have tried to model the emissions avoided through digitisation. The reports most widely used by the private and public sectors until recently are GeSI’s SMARTer 2030 and GSMA’s Enablement Effect.
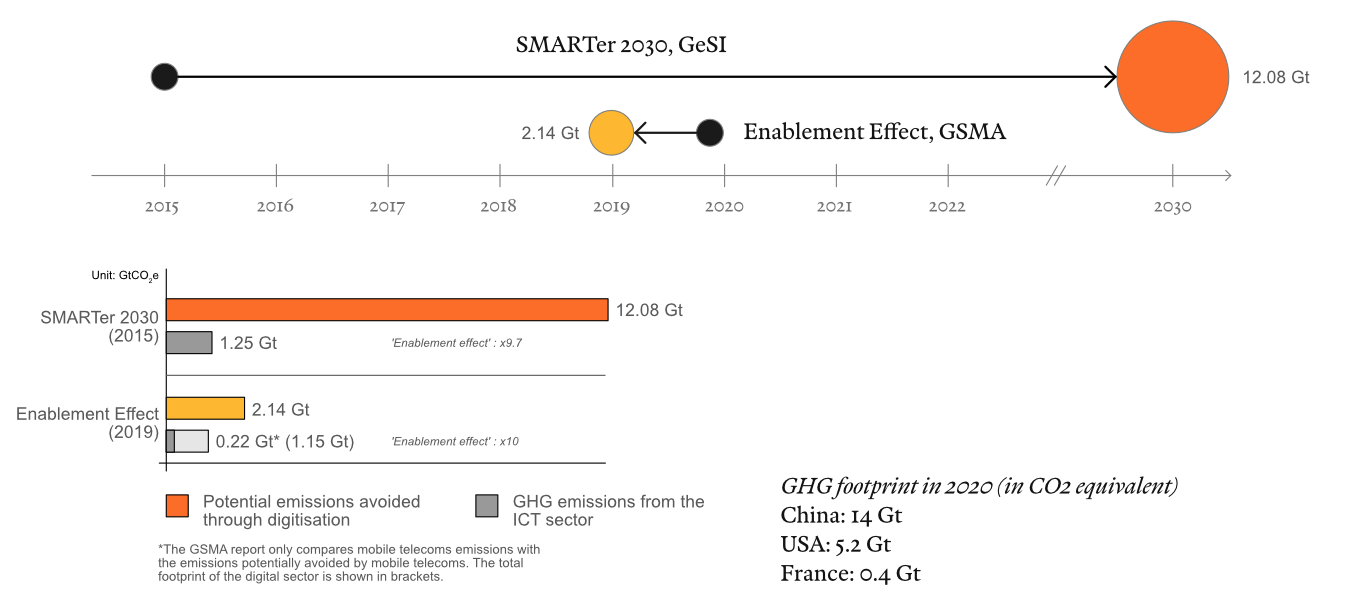
Claims from GeSI and GSMA reports
SMARTer2030 : Digitalization could reduce global GHG emissions by 20% by 2030 (GeSI, 2015)
In 2015, GeSI, an organisation representing the ICT industry on environmental issues, published a new report to estimate the emissions avoided through digitalization. They estimate that global emissions could be reduced by 20% (12 GtCO2e) by 2030 through intensive digitalization of human activities. This report focuses on efficiency and substitution effects in several sectors (energy, industry, transport, agriculture, smart cities, logistics, services) and estimates at the margin direct rebound effects without integrating them in the final result. This type of report is based on over-optimistic assumptions of efficiency with unproven adoption rates.
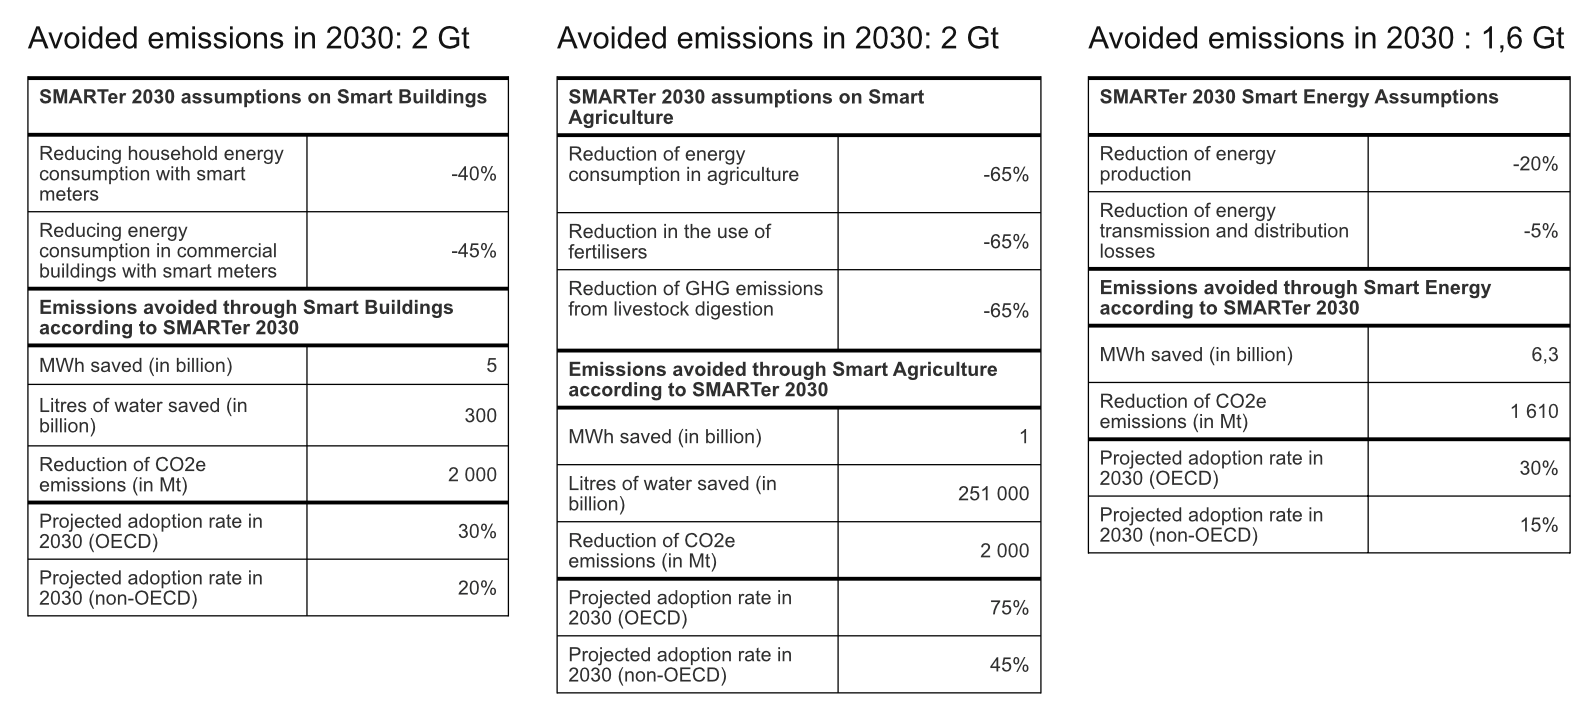
Reminder of the assumptions of the GeSI report
These assumptions and adoption rates are then extrapolated to the global level to estimate possible avoided emissions. Given the input data and methodology, it is preferable not to use these figures and not to base policy decisions on them.
The Enablement Effect : 1 tonne of CO2e emitted by the digital sector means 10 tonnes avoided in other sectors
In 2019, the GSMA, the trade body representing telecom operators, published a report to estimate the emissions avoided through the digital sector. Like GeSI, this report focuses largely on efficiency and substitution gains. However, the estimates are mainly focused on the mobile technology sector, to which telecom operators contribute. They conclude that one tonne of CO2e emitted through mobile technologies avoids 10 tonnes in other sectors en 2018 (2.1 GtCO2e).
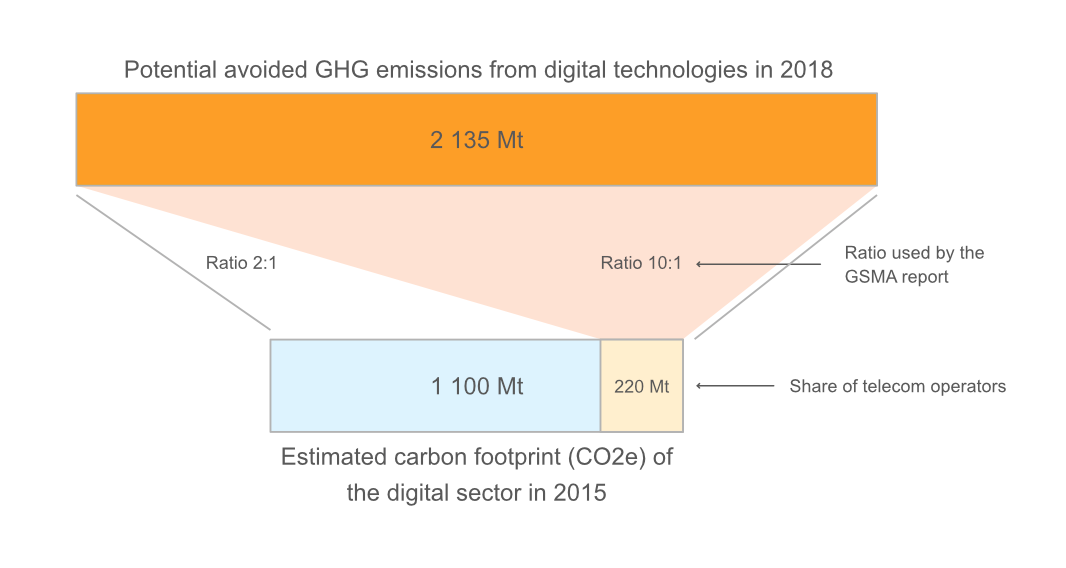
GSMA's 1:10 ratio explanation
In fact, this ratio is obtained by comparing the carbon footprint of telecom operators with the emissions avoided by the digital sector as a whole. This ratio is therefore greatly overestimated and the estimated avoided emissions remain to be verified.
More than half of the emissions avoided in this report are related to an extrapolation of the results of a study conducted on 6,100 people regarding their smartphone use. The representativeness of the sample is questionable, especially when it comes to making a global extrapolation. The method of calculating avoided emissions also needs to be explained to understand the limitations of this kind of modelling exercise.
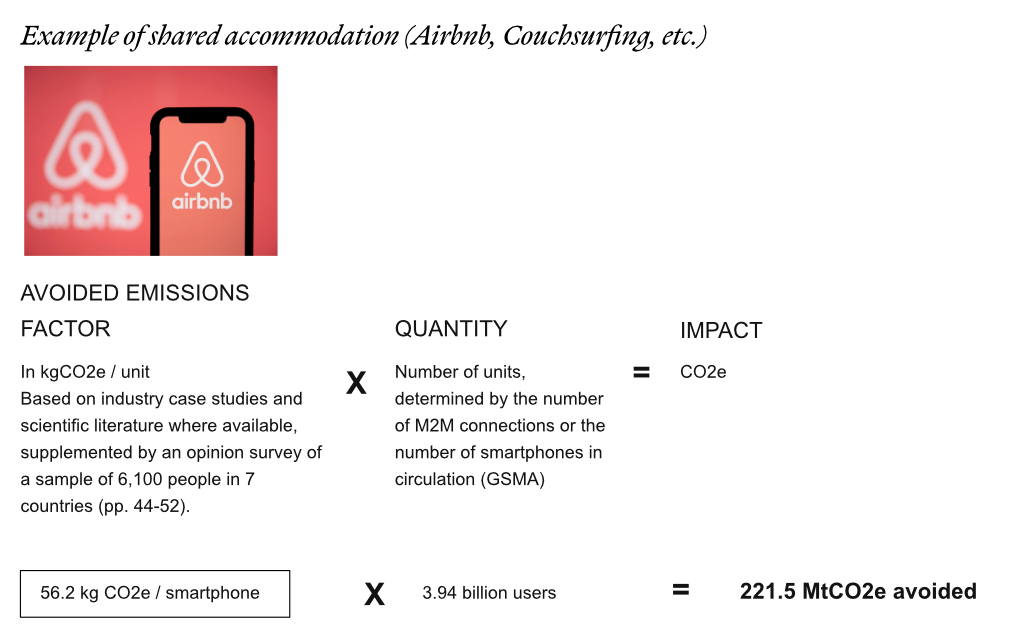
Example of estimate of avoided emissions from home-sharing [1/2]
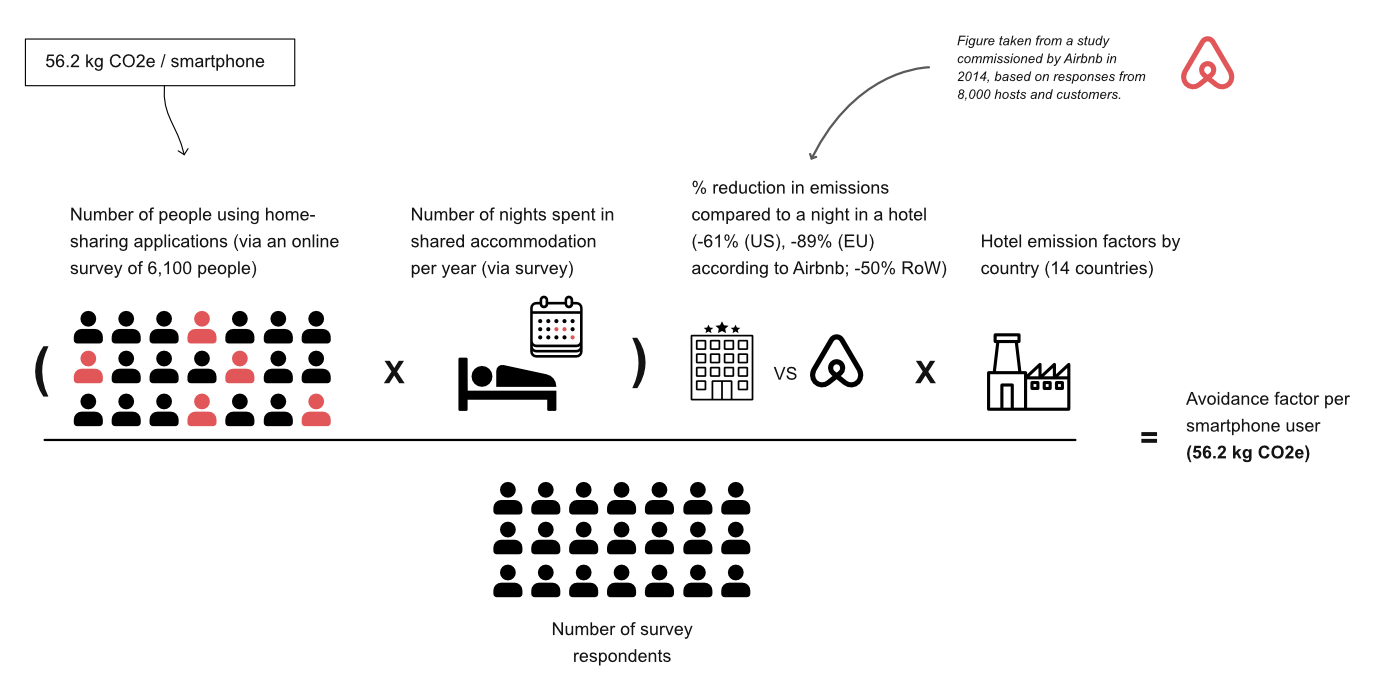
Example of estimate of avoided emissions from home-sharing [2/2]
Extrapolation from data whose representativeness remains to be demonstrated, and the use of reduction hypotheses from a single industrial source renders the modelling exercise invalid. As with the GeSI report, the focus on efficiency and substitution effects at the expense of other effects, and the use of low-quality methodology, reflects the main purpose of these reports: to prove that digitalisation can avoid emissions no matter what. The aim is not to understand under what conditions digitalization can actually reduce emissions from human activities. Unfortunately, the GeSI and GSMA reports are very often mobilised in the writing of public policies and the development of positive discourses around digitalization.
Induction, indirect, economy and society-wide: rebound effects
Rebound effect is one of the indirect effect that is particularly hard to track as it can apply from the micro to the macro scale. A rebound effect is identified as a positive impact (less resources consumed, more efficient process) on a service or product which leads to an increased demand on the latter or beyond. A rebound effect is not necessarily negative as the rebound may have a lower impact than the solution it replaces. Therefore, induction effects link to a more neutral term, that can be both positive and negative. These two terms circulate in a similar way in the scientific literature on the subject.
Coroama and Mattern identify several types of rebound effect that could apply to digital technologies: a direct rebound effect (optimization of a product leads to an increased consumption), a backfire (when the rebound effect is more impactful that the original solution), indirect rebounds (when the rebound happens out of the original scope), time rebound (linked to the cost of time-saving technologies), and macro-level rebounds (economy/society-wide). For instance, based on English travel patterns from 2005 to 2019, Caldarola and Sorrell estimate that while teleworkers take less trips than non-teleworkers, they travel farther, suggesting that teleworking does not reduce travel.
Our results provide little support for the claim that teleworking reduces travel. Indeed, after controlling for a range of variables, we find that the majority of English teleworkers travel farther each week than non-teleworkers. This results from a combination of longer commutes and additional non-work travel. There appears to be a ‘tipping point’, however. If people telework three or more times a week, their weekly private travel (commuting + non-work) is less than that of non-teleworkers. We also find that the total weekly travel of all household members is greater in households where one member is teleworking, suggesting the presence of intra-household effects that further erode the benefits of fewer commutes. (Caldarola and Sorrell 2022)
On a similar topic, Ward et al. study the effects of switching from private vehicle travel to transportation networks companies (TNCs) such as Uber or Lyft. Based on a randomized sampling (Monte-carlo) simulation of 100,000 passenger trips in six U.S. cities, they estimate that shifting from private vehicle travel to TNCs reduces air polluants by 50-60% on average, increases fuel consumption and greenhouse gases emissions by 20% due to deadheading, and external costs by 60% due to congestion, crashes and noise.
On average, we find that shifting travel from a private vehicle to a TNC (Transport Network Companies) reduces externalities from conventional air pollution, increases externalities from GHGs, and reduces the total external costs from all air emissions combined. However, increased vehicle travel from deadheading also increases total congestion, crash, and noise costs, causing a net increase in total external costs, on average (+$0.35/trip, on average). When TNCs displace transit, walking, or biking, rather than personal vehicles, the increase in externalities is about three times larger (+$1.20/trip). However, when TNCs rides are pooled, TNCs can reduce externalities when displacing personal vehicles (−$0.60/trip) but not when displacing transit (+$0.85/ trip) (Ward et al. 2022)
At another scale, a mix of digital services can be modelled in a given city or territory. It is then a question of thinking about the modelling in terms of the precise characteristics of a territory, its geography, its population, etc. This also makes it possible to study the deployment of a given technology with more precise data and without extrapolating too much. For example, Ipsen et al. studied the environmental impact between Copenhagen and a “smart” version of the city that includes nine different technologies. The study shows a decrease in studies during the use phase but an increase in impacts during the resource extraction, manufacturing and end-of-life phases.
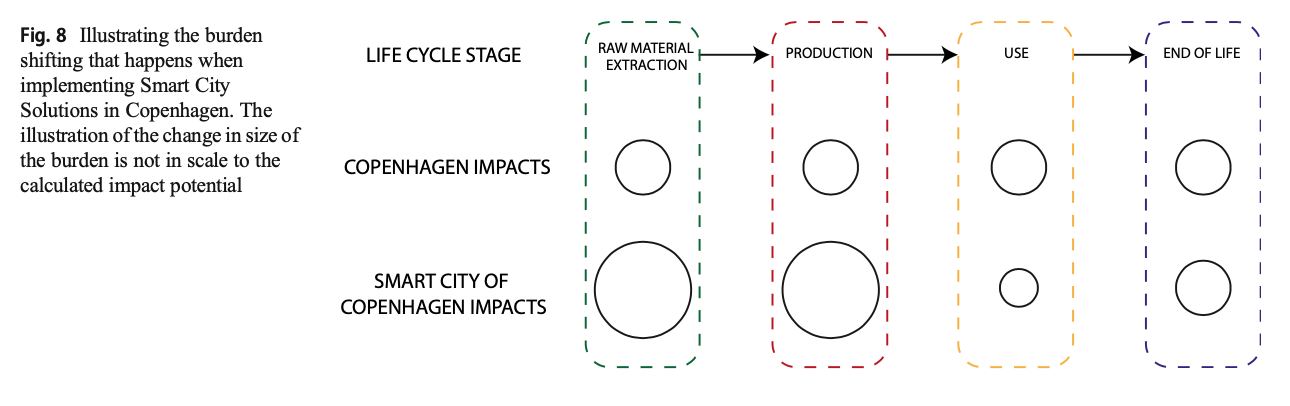
Copenhagen smart city's study
Beyond digitalization
Looking only at direct effects and efficiency and substitution effects provides a very small, and usually false, picture of the real environmental impact of digital solutions. Similarly, extrapolating the use of a digital service implies extrapolating all the success factors: bike sharing applications will have much less effect in cities without bike infrastructure, connected thermostats will have less effect in buildings without good insulation. Indirect effects usually depend on factors external to the digital service. With this in mind, extrapolating the benefits or harms of digital services becomes much more complex, if not irrelevant. It is now necessary to understand the deployment and use of a technology over a sufficiently large area of use to observe the full range of indirect effects while avoiding extrapolation. Under these conditions, the positive effects of digitisation are much less significant than estimated and remain insufficient to achieve the ecological transition targets.
[…] the mechanisms behind rebound effects in general, and thus of digital rebound as well, are essentially non-technical in nature. Their roots reside in eco- nomics and in human behavior. It is thus highly unlikely that digital rebound can be addressed solely through technologi- cal means. While digitalization does often wait on the side- line, ready to provide efficient substitutes for existing tech- nologies and processes, the avoidance of digital rebound effects needs to be enforced differently, possibly by policy measures. (Coroama et Mattern, 2019)
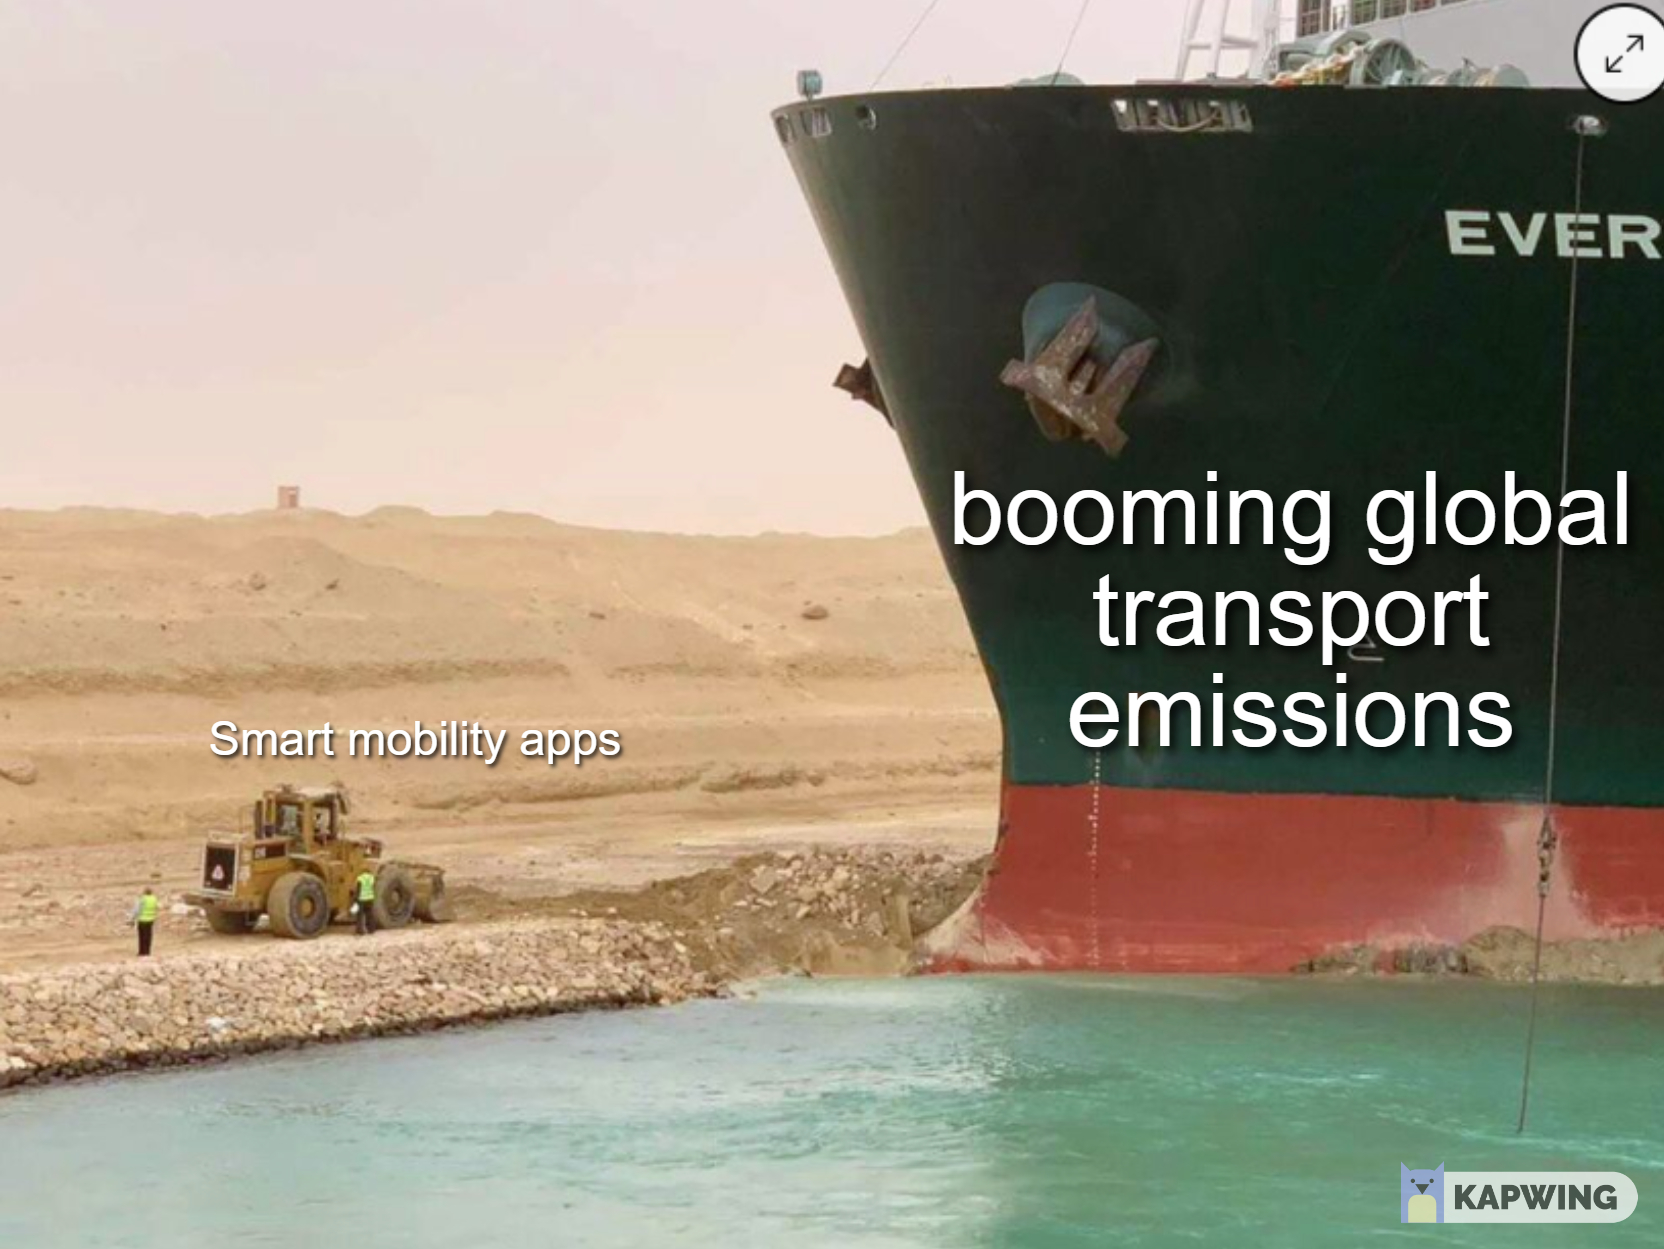
ADEME IT4GREEN - 2025
While we have been able to criticise the methodology of industry studies (GeSi, GSMA) that paint an overly optimistic picture of the contribution of digitalisation to the ecological transition, until last week there were no real quantitative counter-studies to inform an alternative discourse. However, we recently published the first state-produced assessment of the net impact of a digitalisation solution. The preliminary findings of this ongoing study, which is due to conclude in February, differ significantly from those of the industry .
We will present the results of the study next sessions

_Environmental assessment of the direct and indirect effects of digital technology for use cases , ADEME, 2015_
Resources
Syllabus
- Vlad Coroama and Friedemann Mattern, Digital Rebound – Why Digitalization Will Not Redeem Us Our Environmental Sins, 2019
To go further
- Nathaniel Horner et al.,Known unknowns: indirect energy effects of information and communication technology, 2016
- Vlad Coroama et al., A methodology for assessing the environmental effects induced by ict services: Part i: Single service, 2020
- Permilla Bergmark et al., A methodology for assessing the environmental effects induced by ict services: Part ii: Multiple services and companies, 2020
- C. Bieser and L. M. Hilty, Assessing indirect environmental effects of information and communication technology: A systematic literature review, 2019
- B. Caldarola and S. Sorrell, Do teleworkers travel less? evidence from the english national travel survey, 2022
- Nicolas Coulombel et al., Substantial rebound effects in urban ridesharing: Simulating travel decisions in Paris, France, 2019
- Aina Rasoldier et al., How realistic are claims about the benefits of using digital technologies for ghg emissions mitigation?, 2022
- Steve Sorrell et al., Digitalisation of goods: a systematic review of the determinants and magnitude of the impacts on energy consumption, 2020
- J. W. Ward et al., Air pollution, greenhouse gas, and traffic externality benefits and costs of shifting private vehicle travel to ridesourcing service
Session 10 : GenAI - Harder, Better, Faster, Stronger
In progress…
Case studies
Case Study : Amazon Go
In 2016, Amazon launched Amazon Go, a ‘Just Walk Out’ supermarket. They advertised the project with a major marketing campaign.
The project and its aggressive marketing campaign was a source of joke in Saturday Night Live (SNL)
However, the project was eventually terminated in 2026. Several reasons explained such fail :
- Cost: The cost of such technology, which relies on sensors, cameras and AI models, was enormous compared to the low retail margin.
- New manual tasks: In reality, many manual tasks were needed on site. For instance, products needed to be replaced manually to fit the system.
- Privacy issues: Many customers were uncomfortable with being monitored while shopping.
- New constraints: Amazon Go required shoppers to download an app to enter the shop, whereas regular shops could be entered without constraints.
- Theft and errors: The system was far less efficient at identifying theft and errors. This is an issue that is all the more important in a sector with very low margins.
But worst of all, several years later, in 2024, a journalist revealed that the Amazon Go automatic AI system was actually supervised from India by 1,000 human workers.
In the face of this failure, Amazon eventually launched a far less ambitious project: the Amazon Dash Cart.
This example shows how tech companies promote technological imaginaries with the aim of making them performative. However, if they don’t publicise their failures, their innovations are not linear, but rather a series of ups and downs determined by socio-technical constraints.
Case study: Silicon Valley 80’ - Original Sin
Tip
This case study is based on the paper “From Clean Rooms to Dirty Water” by Christophe Lécuyer.
Silicon Valley was fertile ground for a major environmental and occupational health controversy in the late 1970s and 1980s. It had a very large industry that had contaminated many aquifers and severely affected the health of thousands of workers. But it is very likely that the full extent of pollution and workplace hazards would never have been known and addressed had it not been for the drive, courage, and tenacity of a group of young women: Amanda Hawes, Patricia Lamborn, and Robin Baker of SCCOSH; Marta Rojas, Cathi Hee, and Cathy Bauerle of Signetics; Susan Yoachum of the San Jose Mercury News; and Lorraine Ross and her San Jose neighbors. […] Without them, the Valley might have remained the “clean” and “safe” place it used to be in the 1960s and 1970s. (Christophe Lécuyer, p.326)
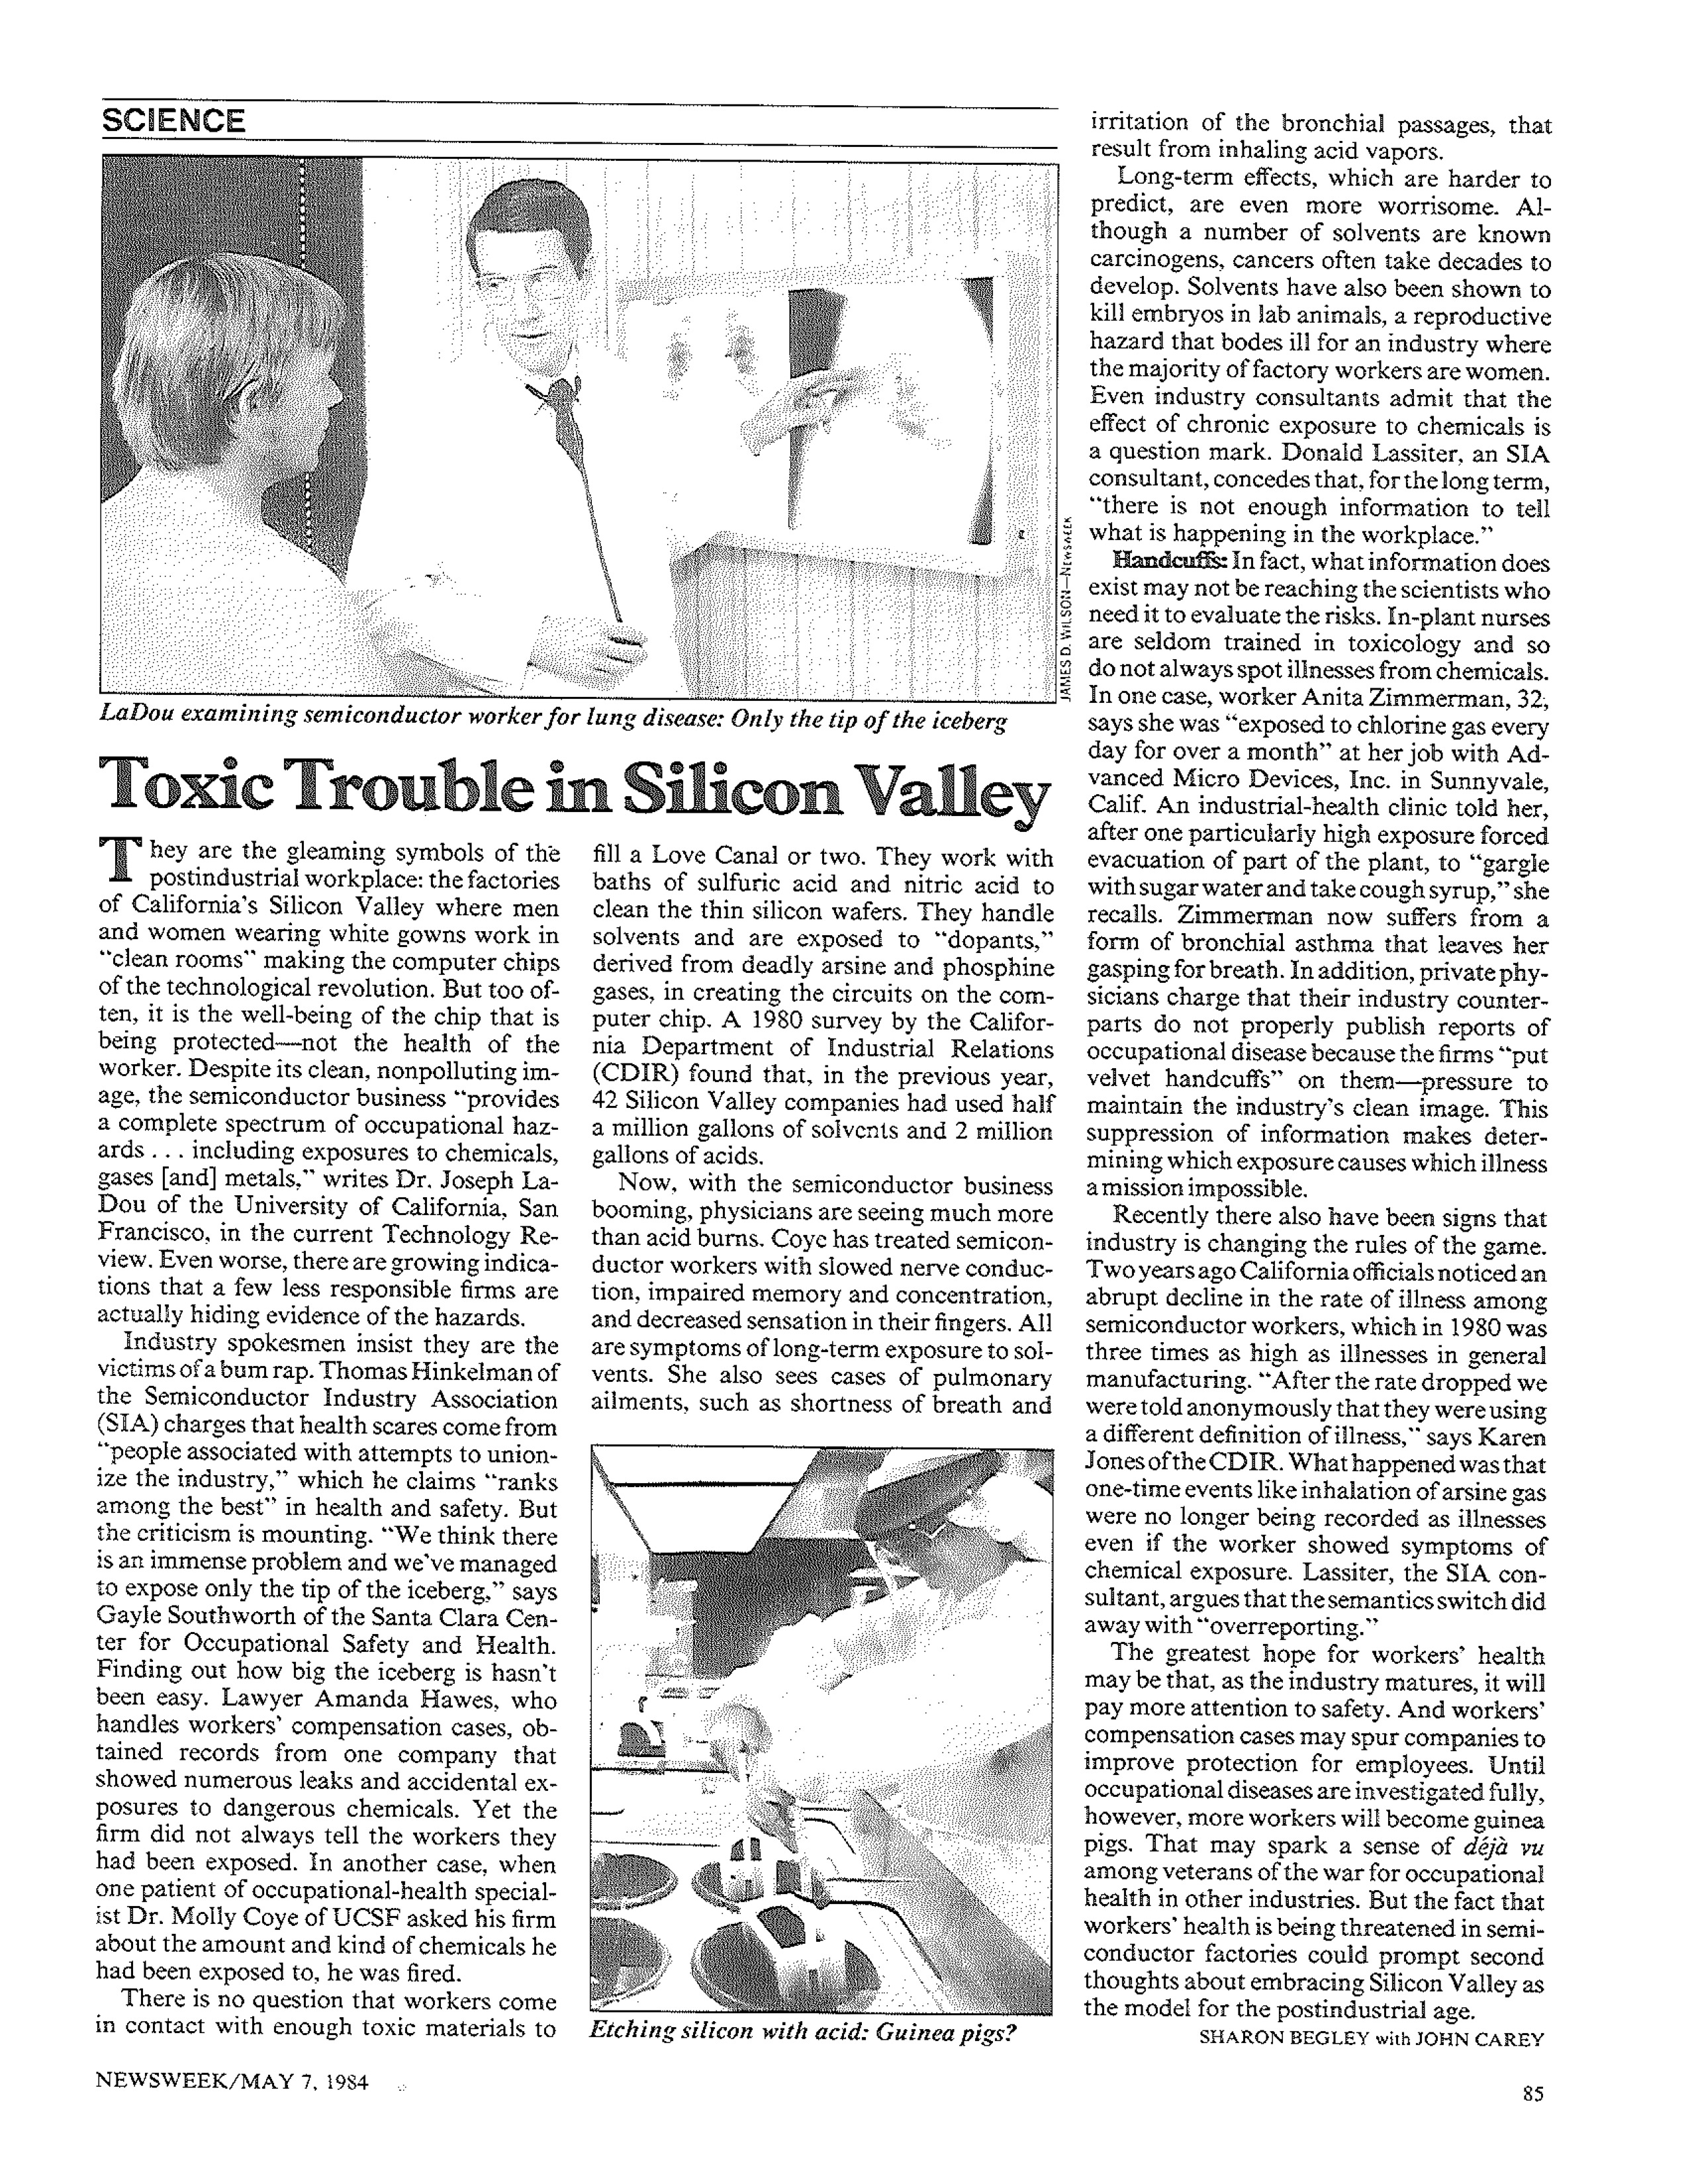
The Silicon Valley shows an interesting paradox on the matter. It is one of the birthplace of innovation and modern technologies, especially semiconductors, it is also one of the regions with the most Superfund sites, i.e. the most polluted locations, in the nation. The myth of the immateriality was conceived mostly by people that gravitated around this area, so how come they did not see these polluting activites that were providing them chips and computers?
The growing number of polluted sites came as a major surprise to engineers and managers working in the semiconductor industry. “I was shocked,” an AMD engineer later recalled. “Everybody was. We had all considered the chip industry to be super-clean, all being proved by our smokeless chimneys, clean green lawns, and nice-looking buildings. The leaking solvents problem surprised everyone in the Valley.” (Christophe Lécuyer, p.322)
The environmental movement in the Silicon Valley is quite unsual because it was spearheaded by labor activits, according to Christophe Lécuyer. They attacked microelectronics companies on their poor safety records to unionize the industry. While their unionizing effort failed, they led to the discovery of large-scale water pollution due to leaking underground tanks. Companies were forced to improve safety but scandals kept coming (in Los Paseos, miscarriages and birth defects were three times higher than in the whole California). This situation deeply modified the credibility of microelectronics firms and led to the creation of the EPA’s superfund program. Today, a large part of the semiconductor manufacturing is outsourced in Asia, especially in Japan, South Korea, Taiwan and China so these environmental issues have almost disapparead in California. (See interactive map of U.S. superfund sites here and here)
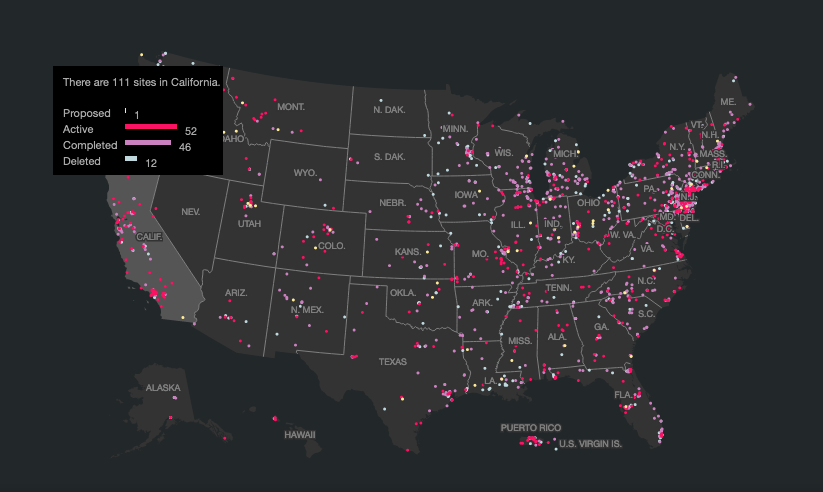
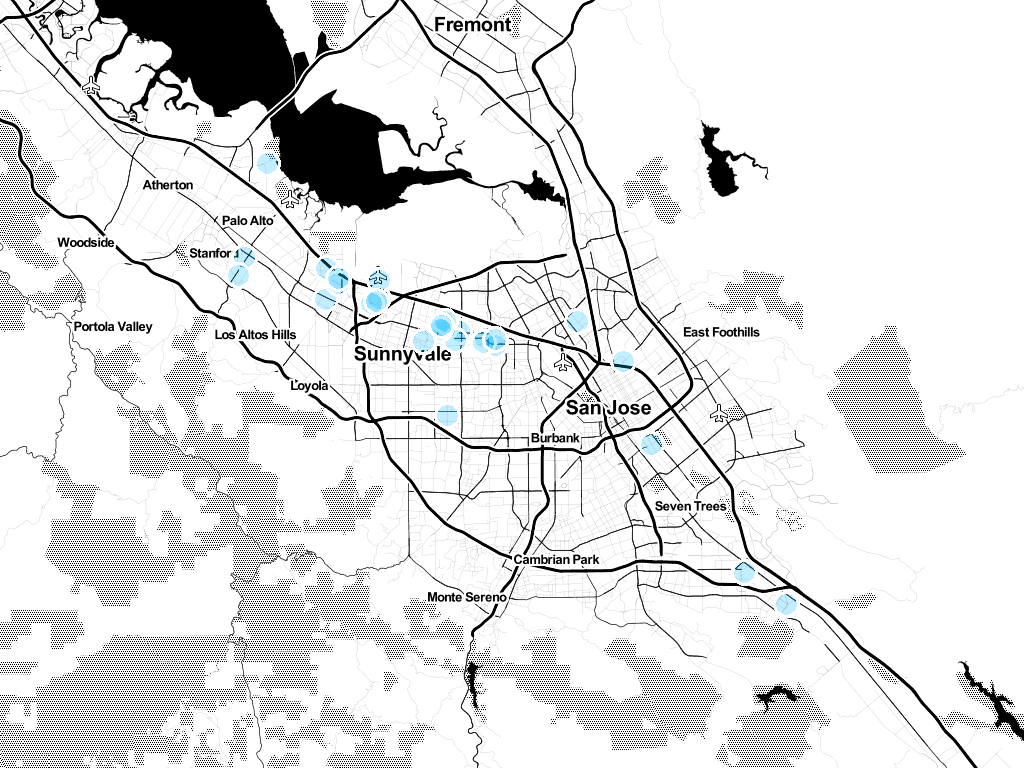
The environmental movement in the Silicon Valley was mainly led by the left wing of the labor movement (confrontational, antimanagement, anticapitalist, and prounion). However, corporations told a very different story than the grassroot labor movement and shaped the imaginaries around the Silicon Valley and its industry. We can only assume that thinkers from the Valley couldn’t (or decided not to) see the environemental damage unfolding down south and rather follow the storyline displayed by the semiconductor manufacturing industry.
The history of antitoxics organizing in Silicon Valley is full of paradoxes. It started with a campaign to unionize the microelectronics industry and ended up initiating a massive, federally mandated environmental remediation program. Labor activists turned into environmentalists, and the organization that drove the movement splintered as it obtained its greatest success. Social activism is full of uncertainty indeed. (Christophe Lécuyer, p.327)
Case study : Ardèche
_Map of fibre optic deployment in France, Ardeche T1 2025 - ARCEP_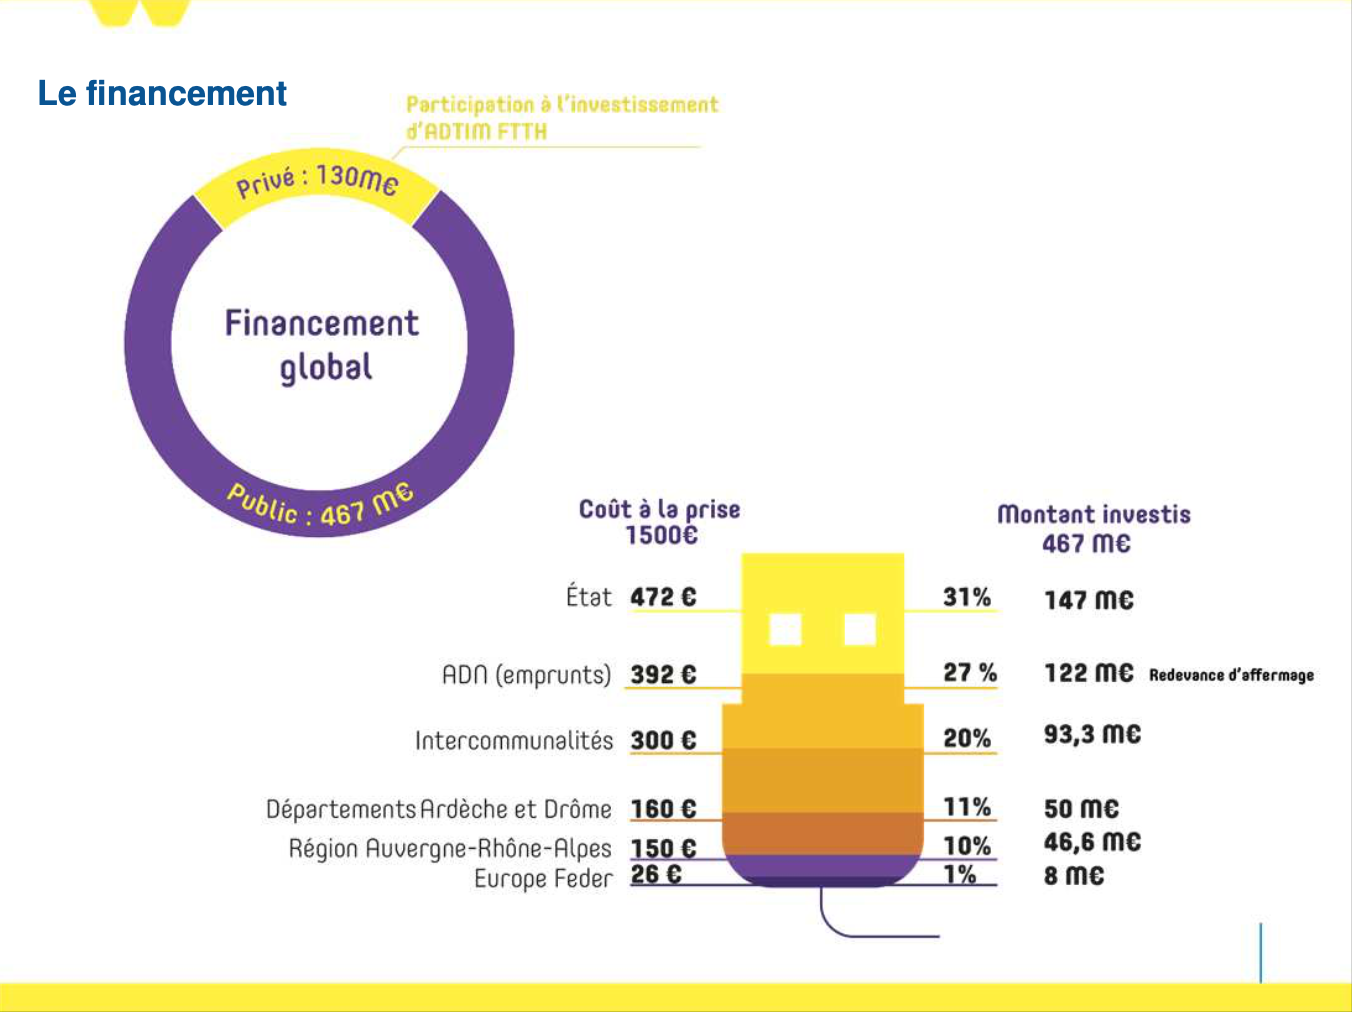
The cost of deploying fiber networks in Ardèche-Drôme - Credits: ADN
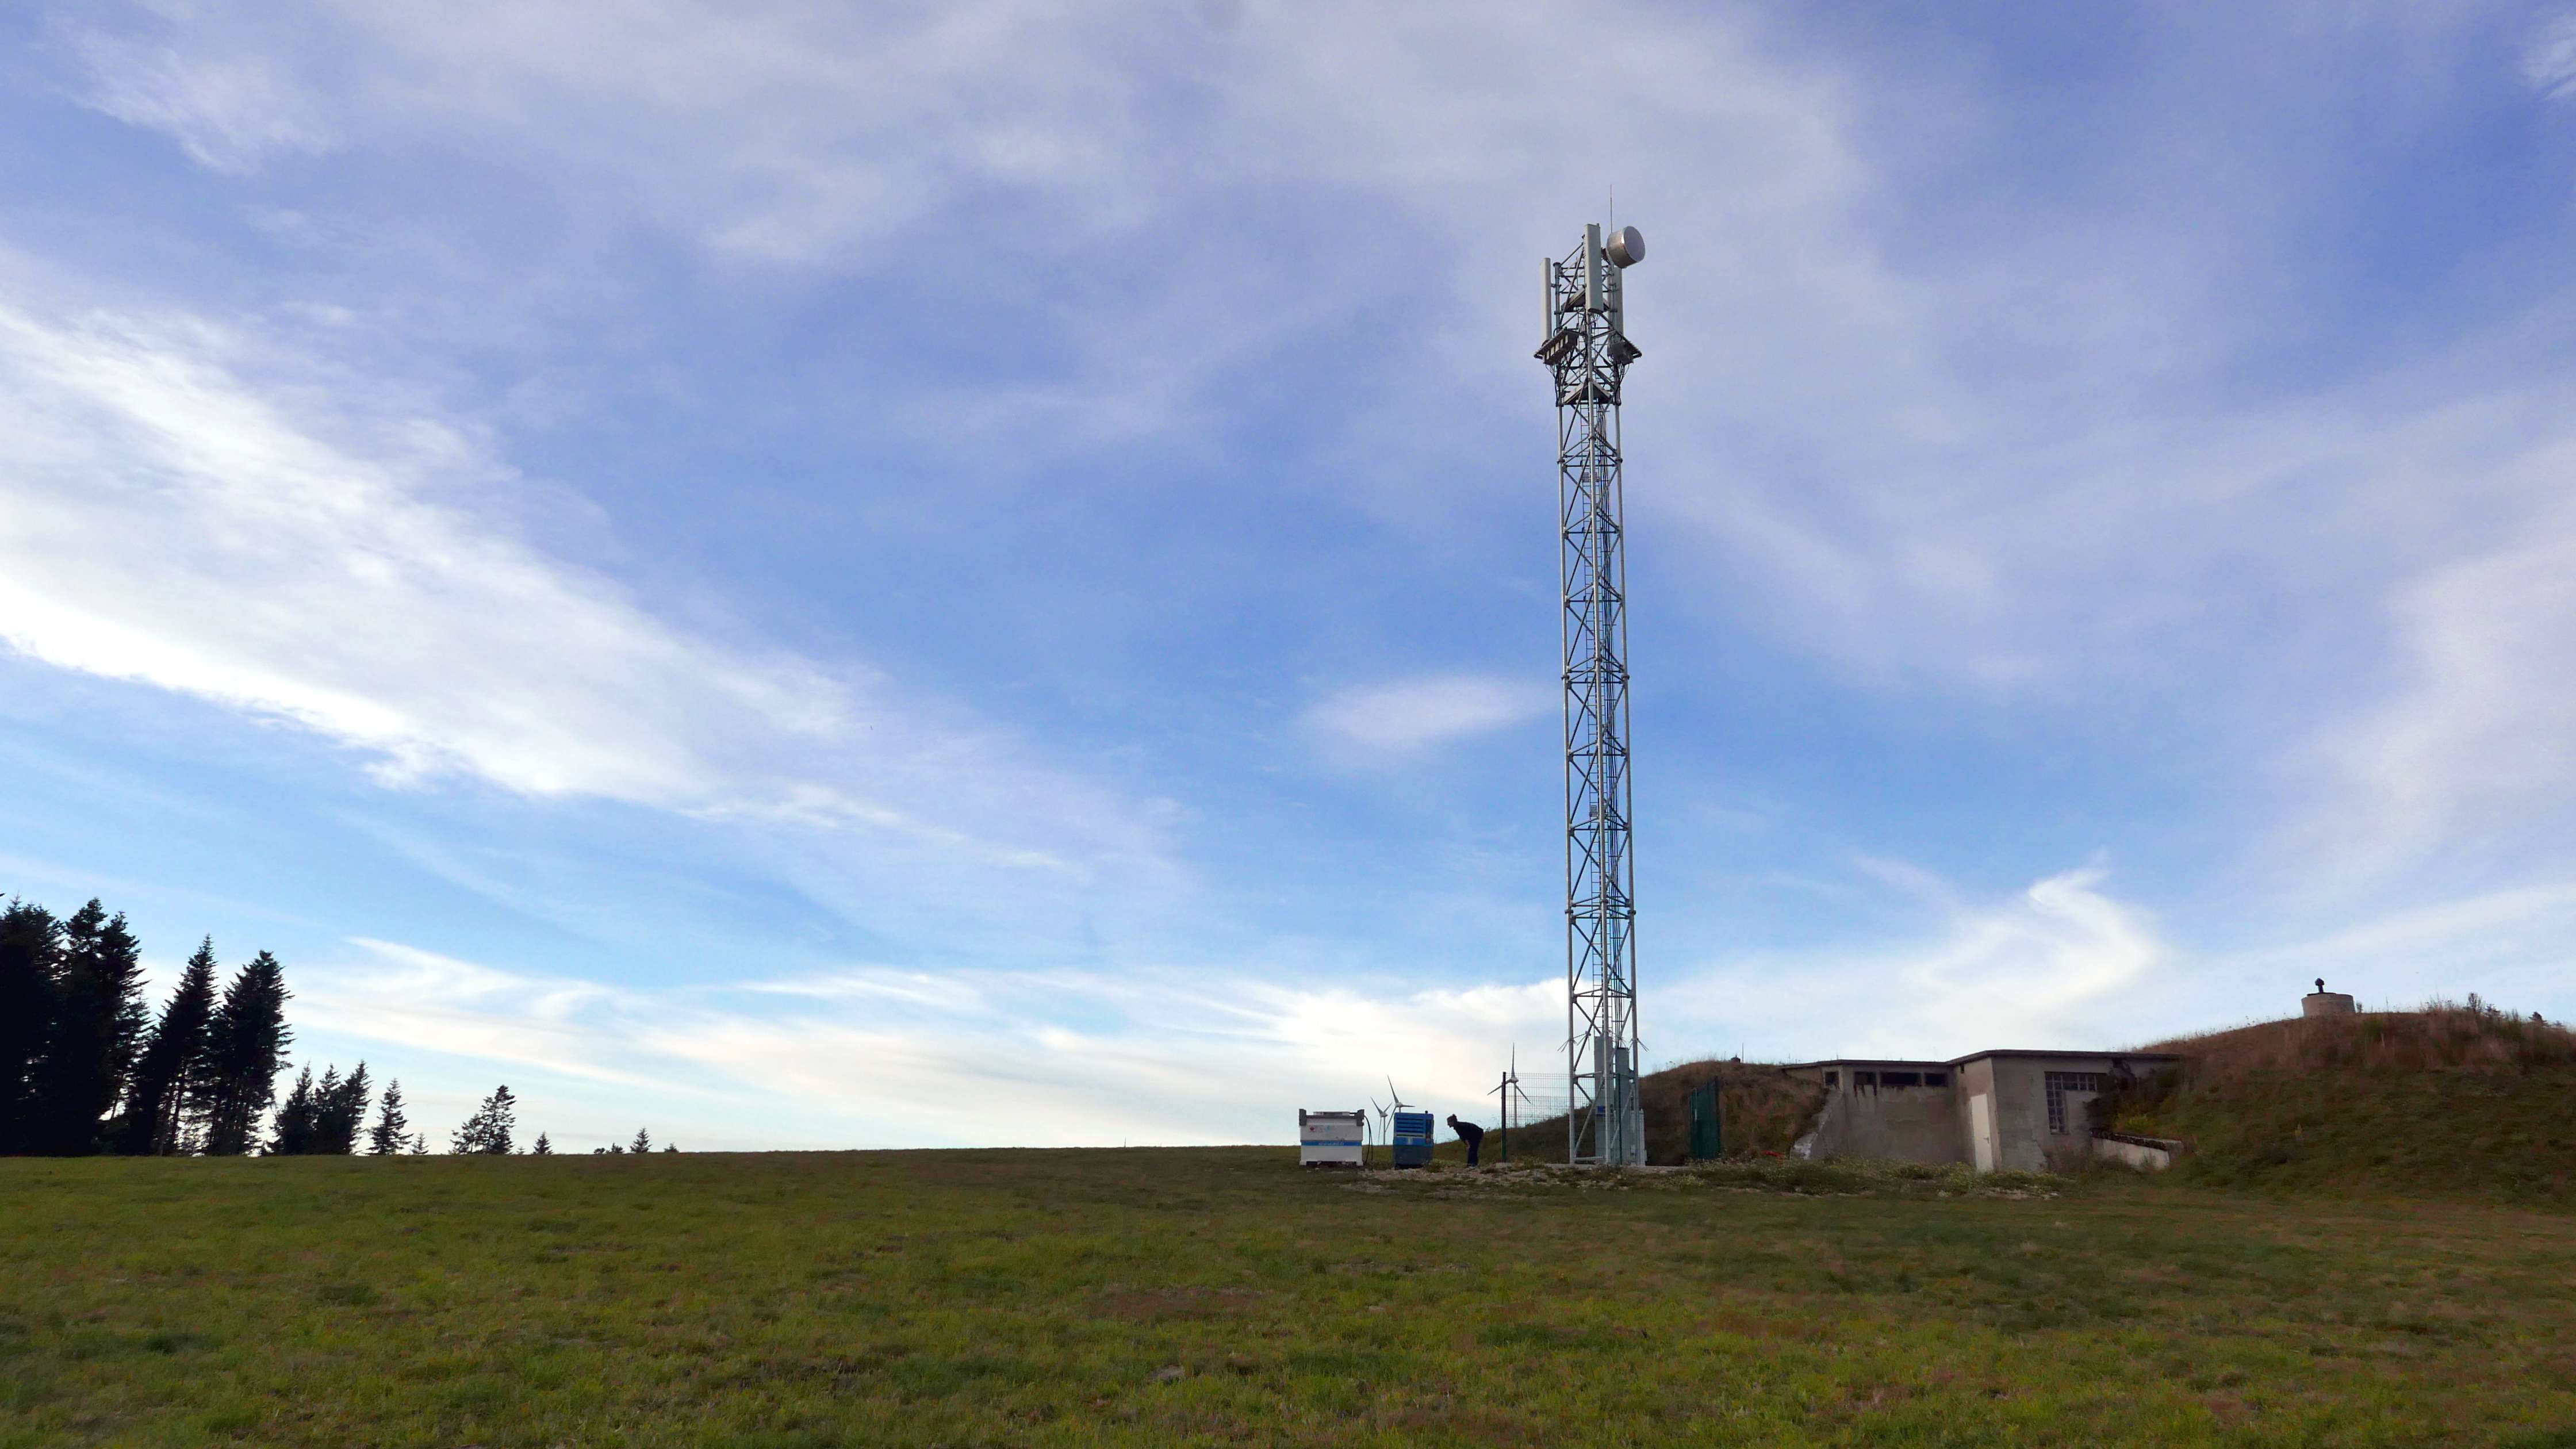
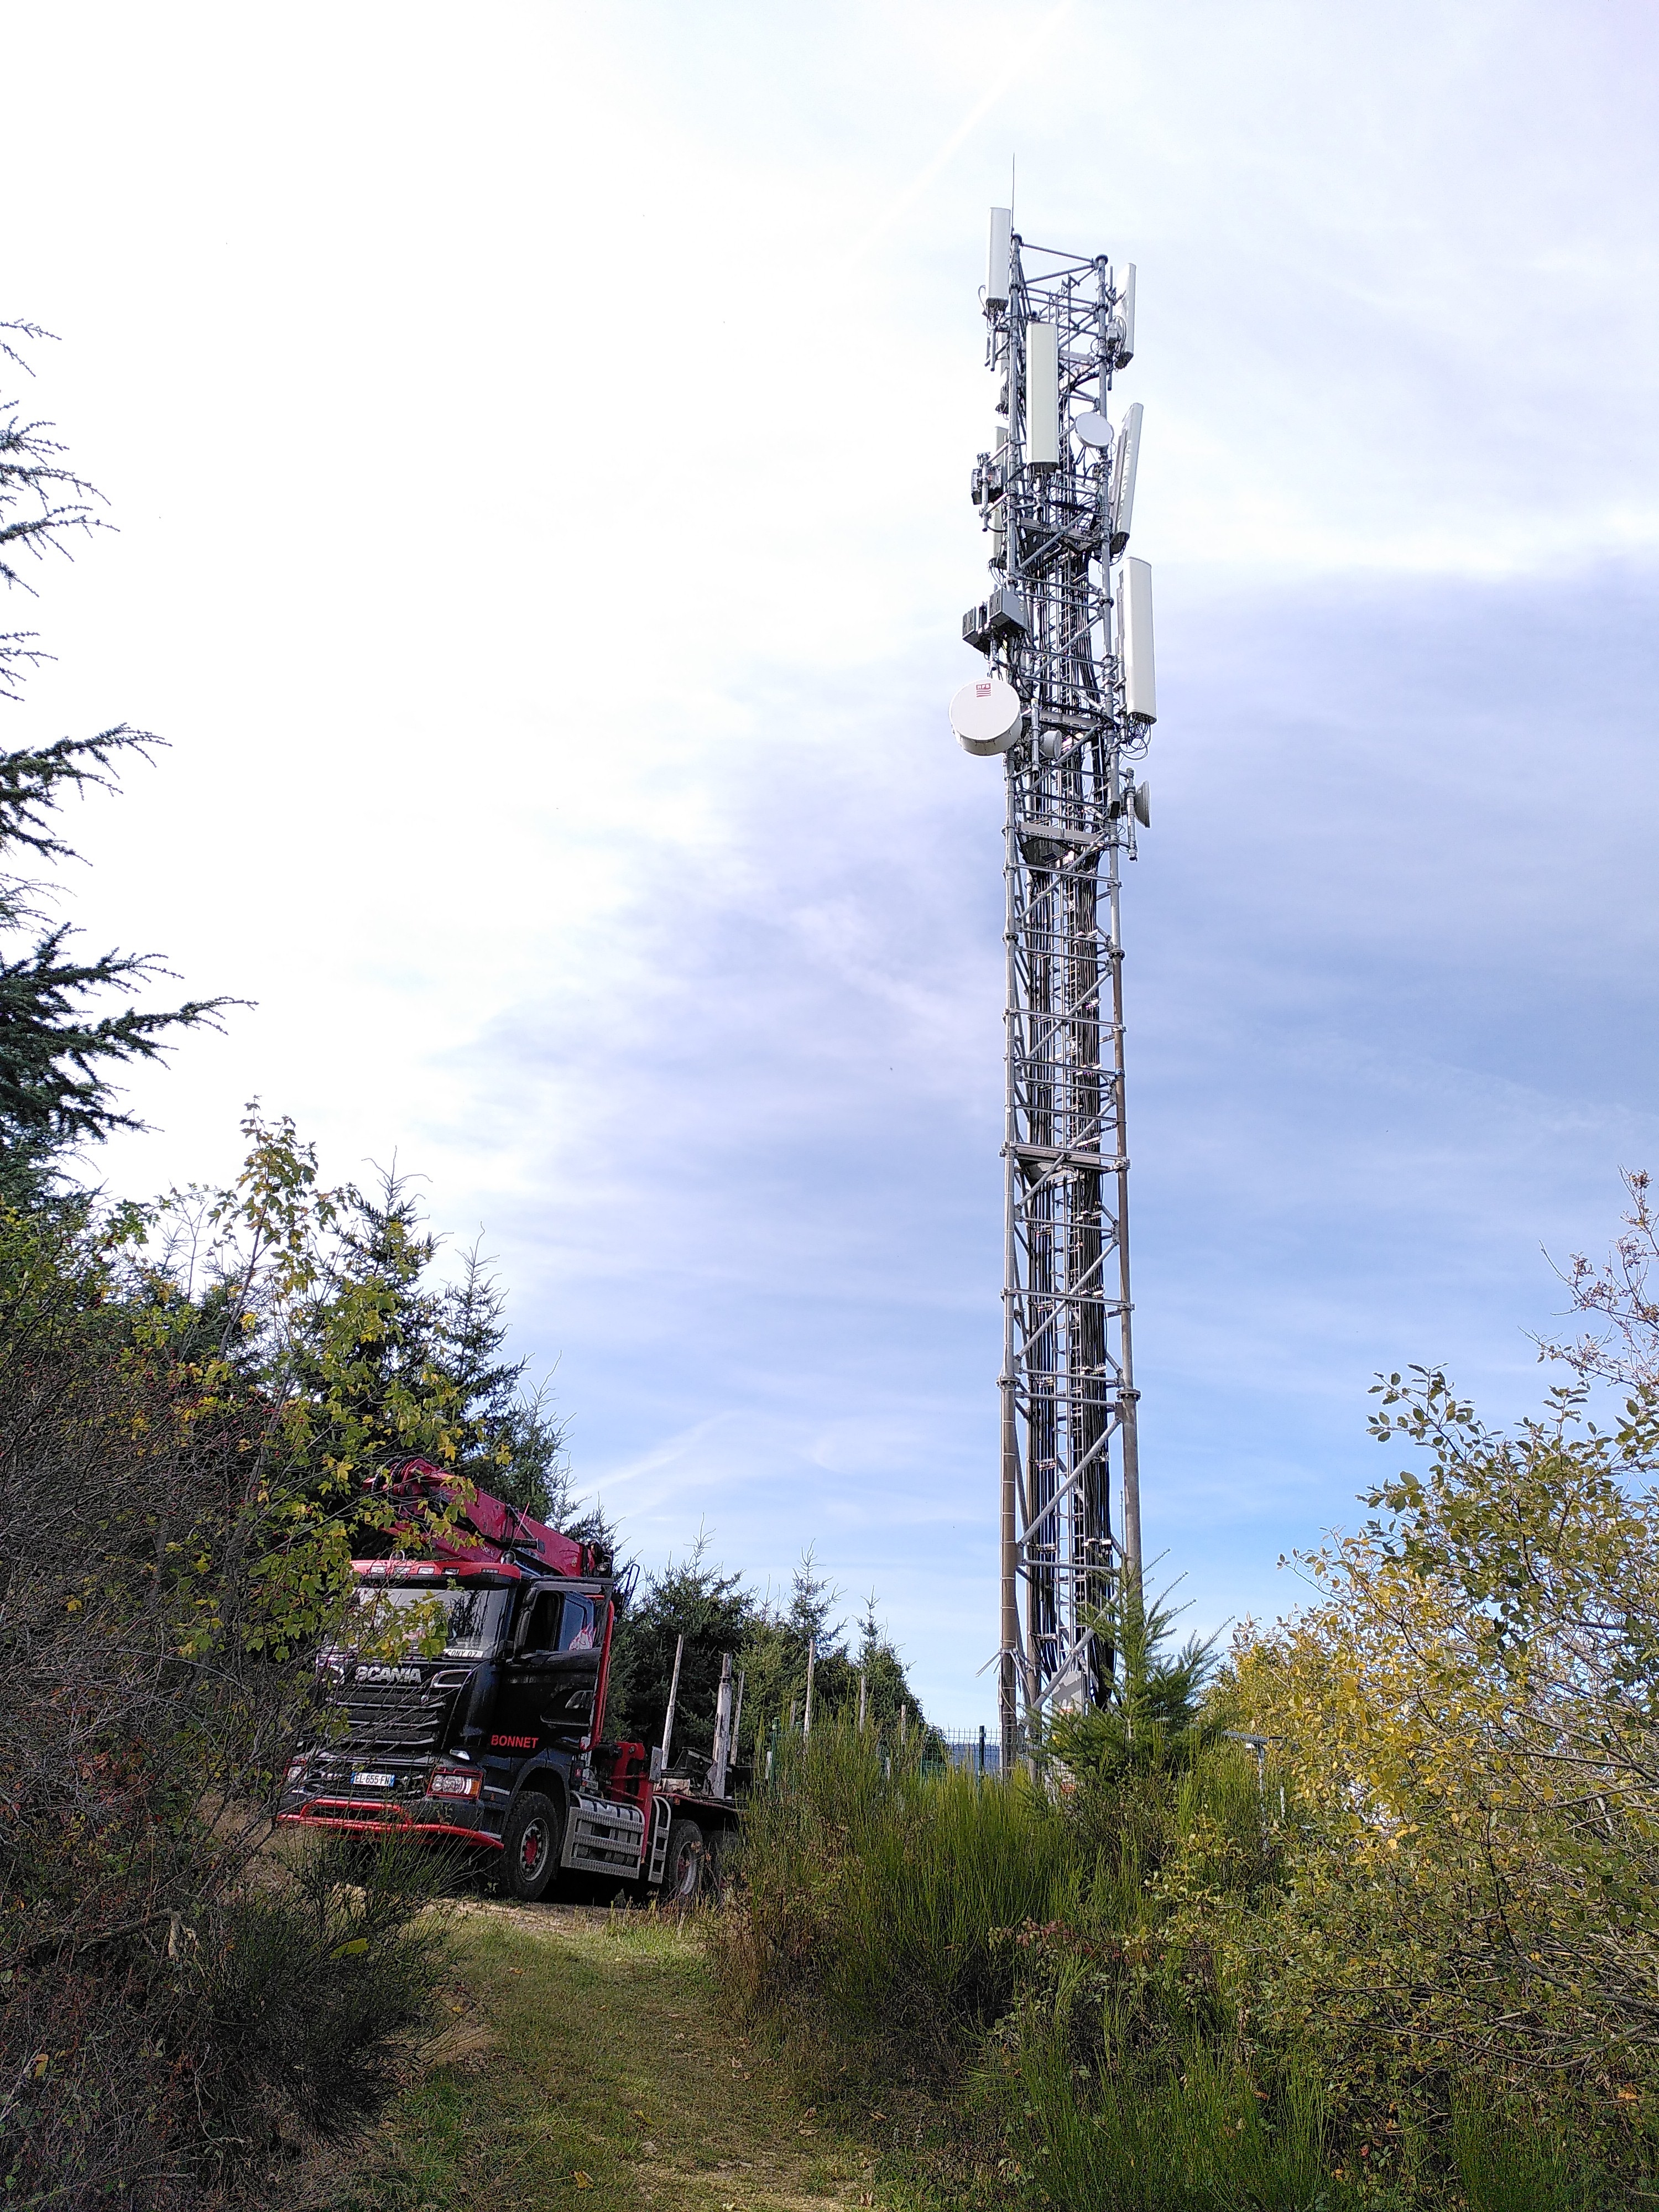
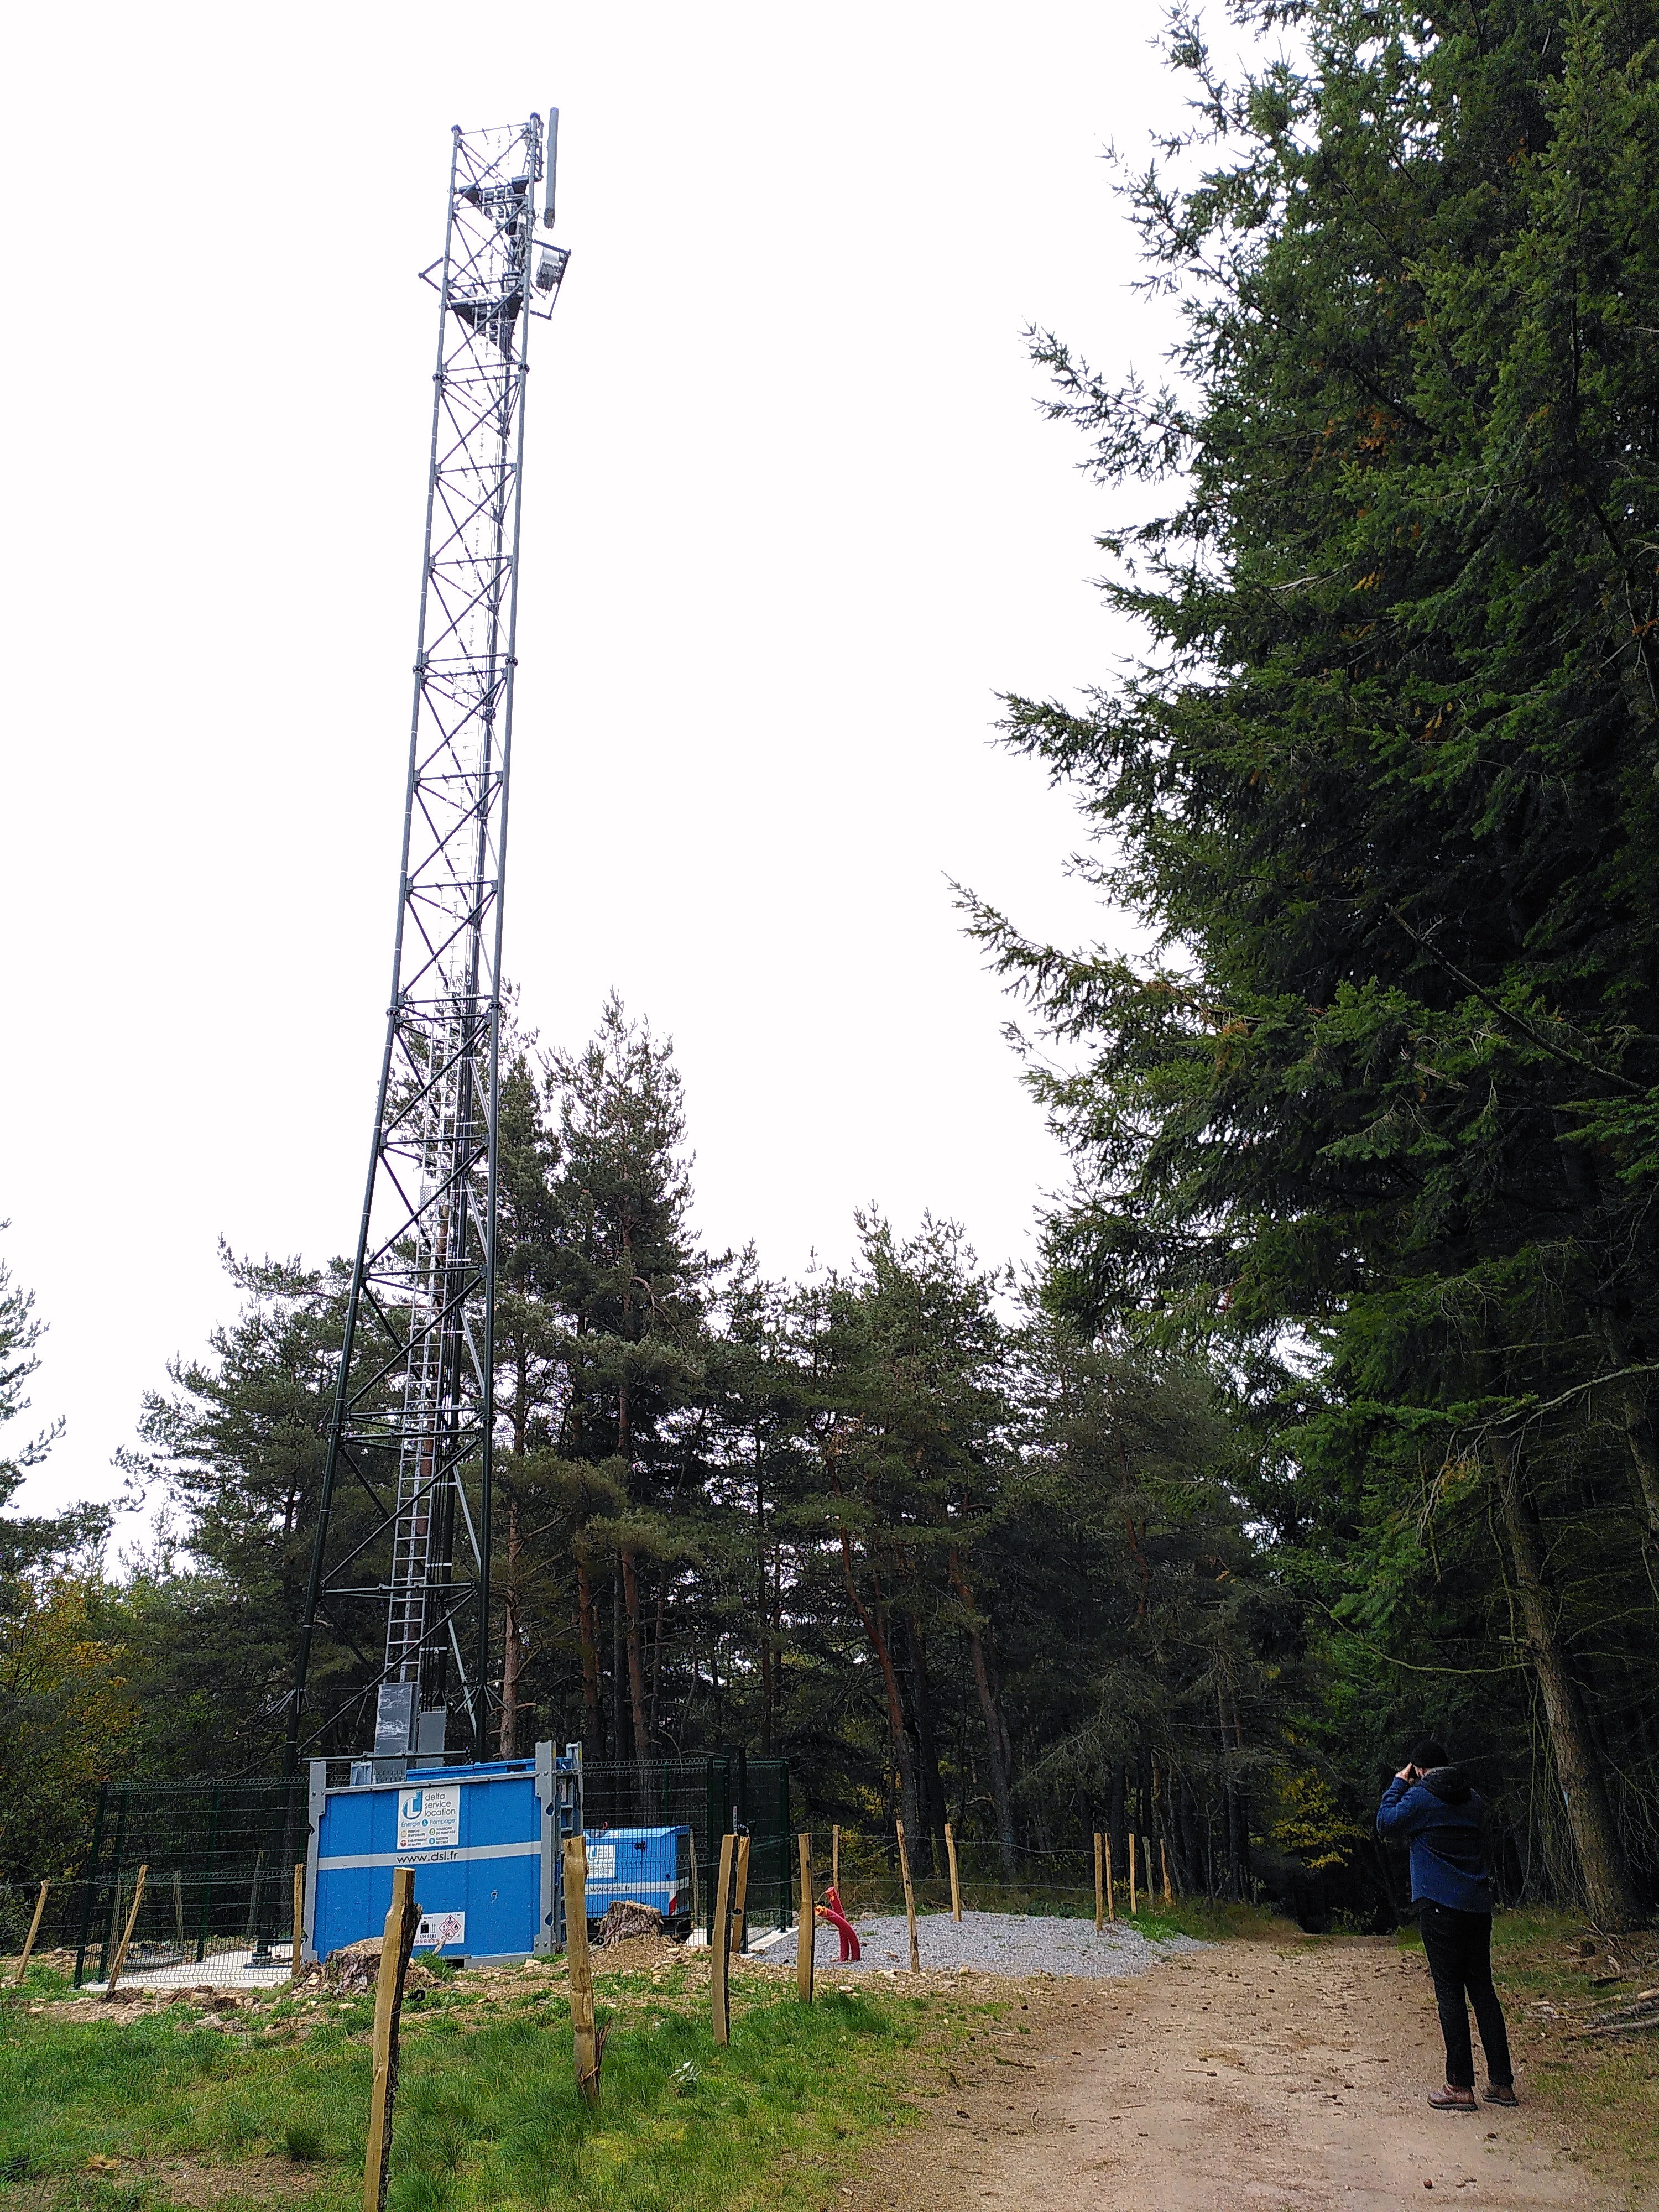
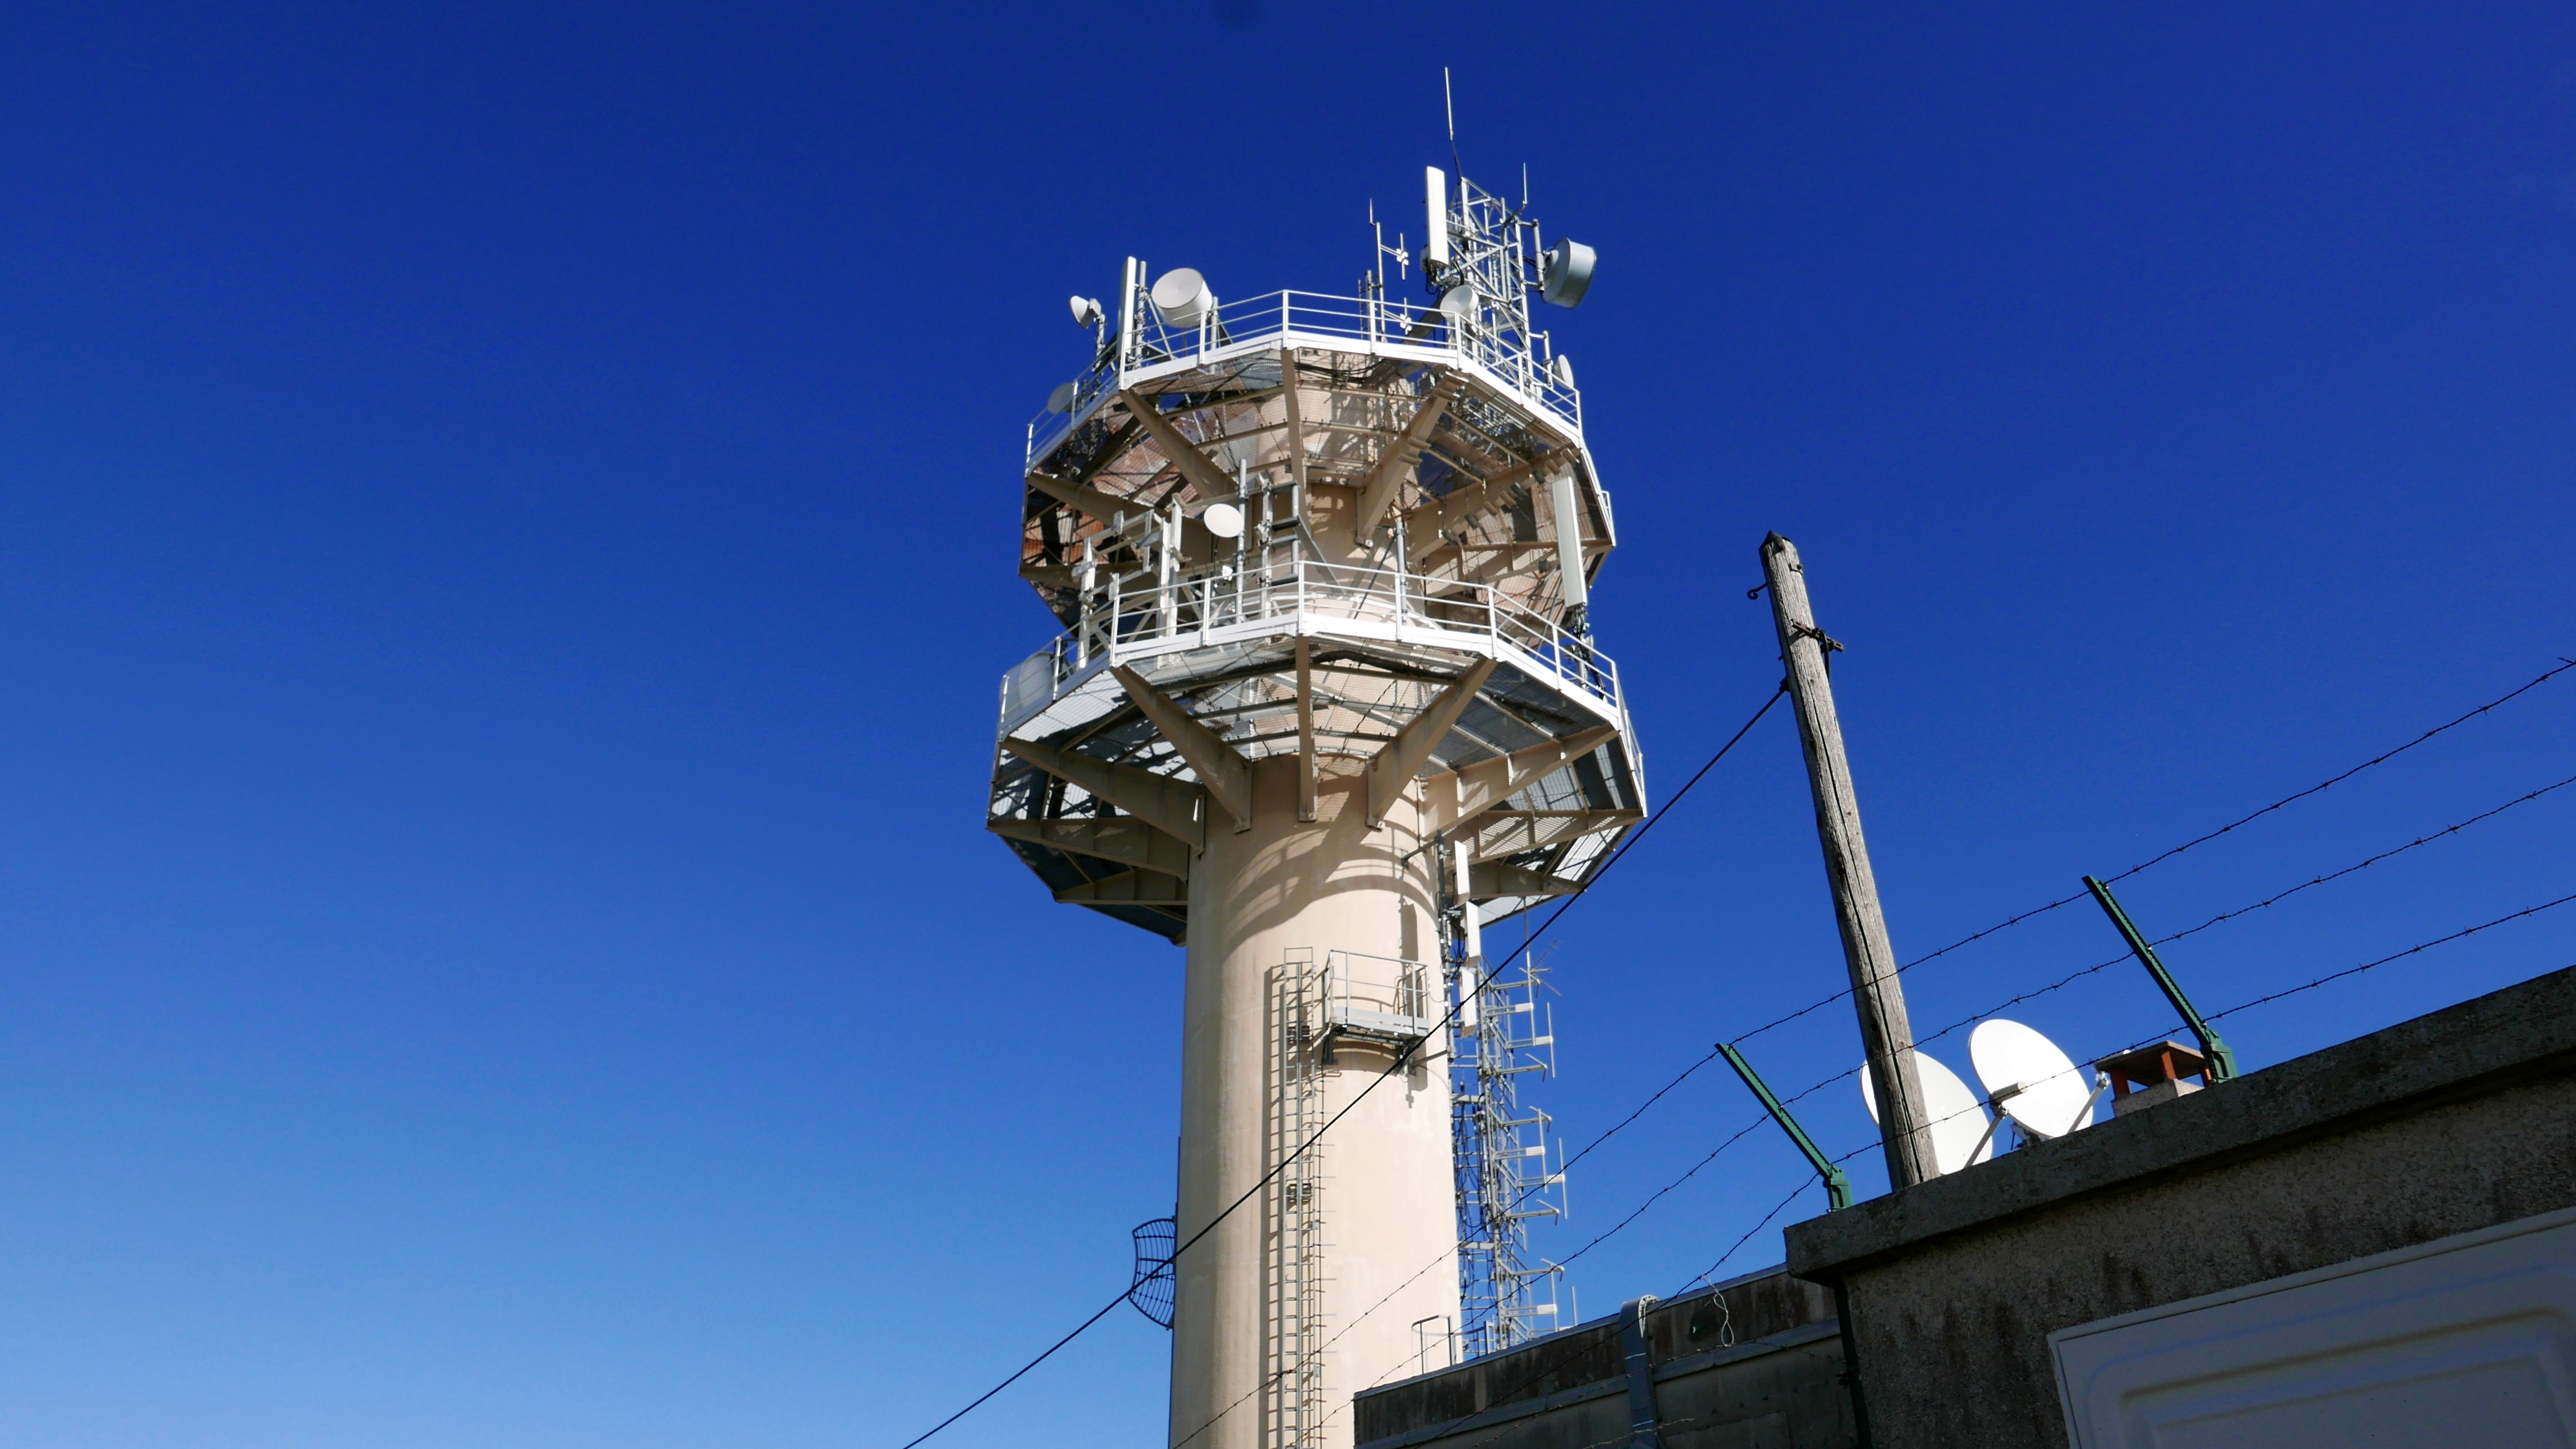
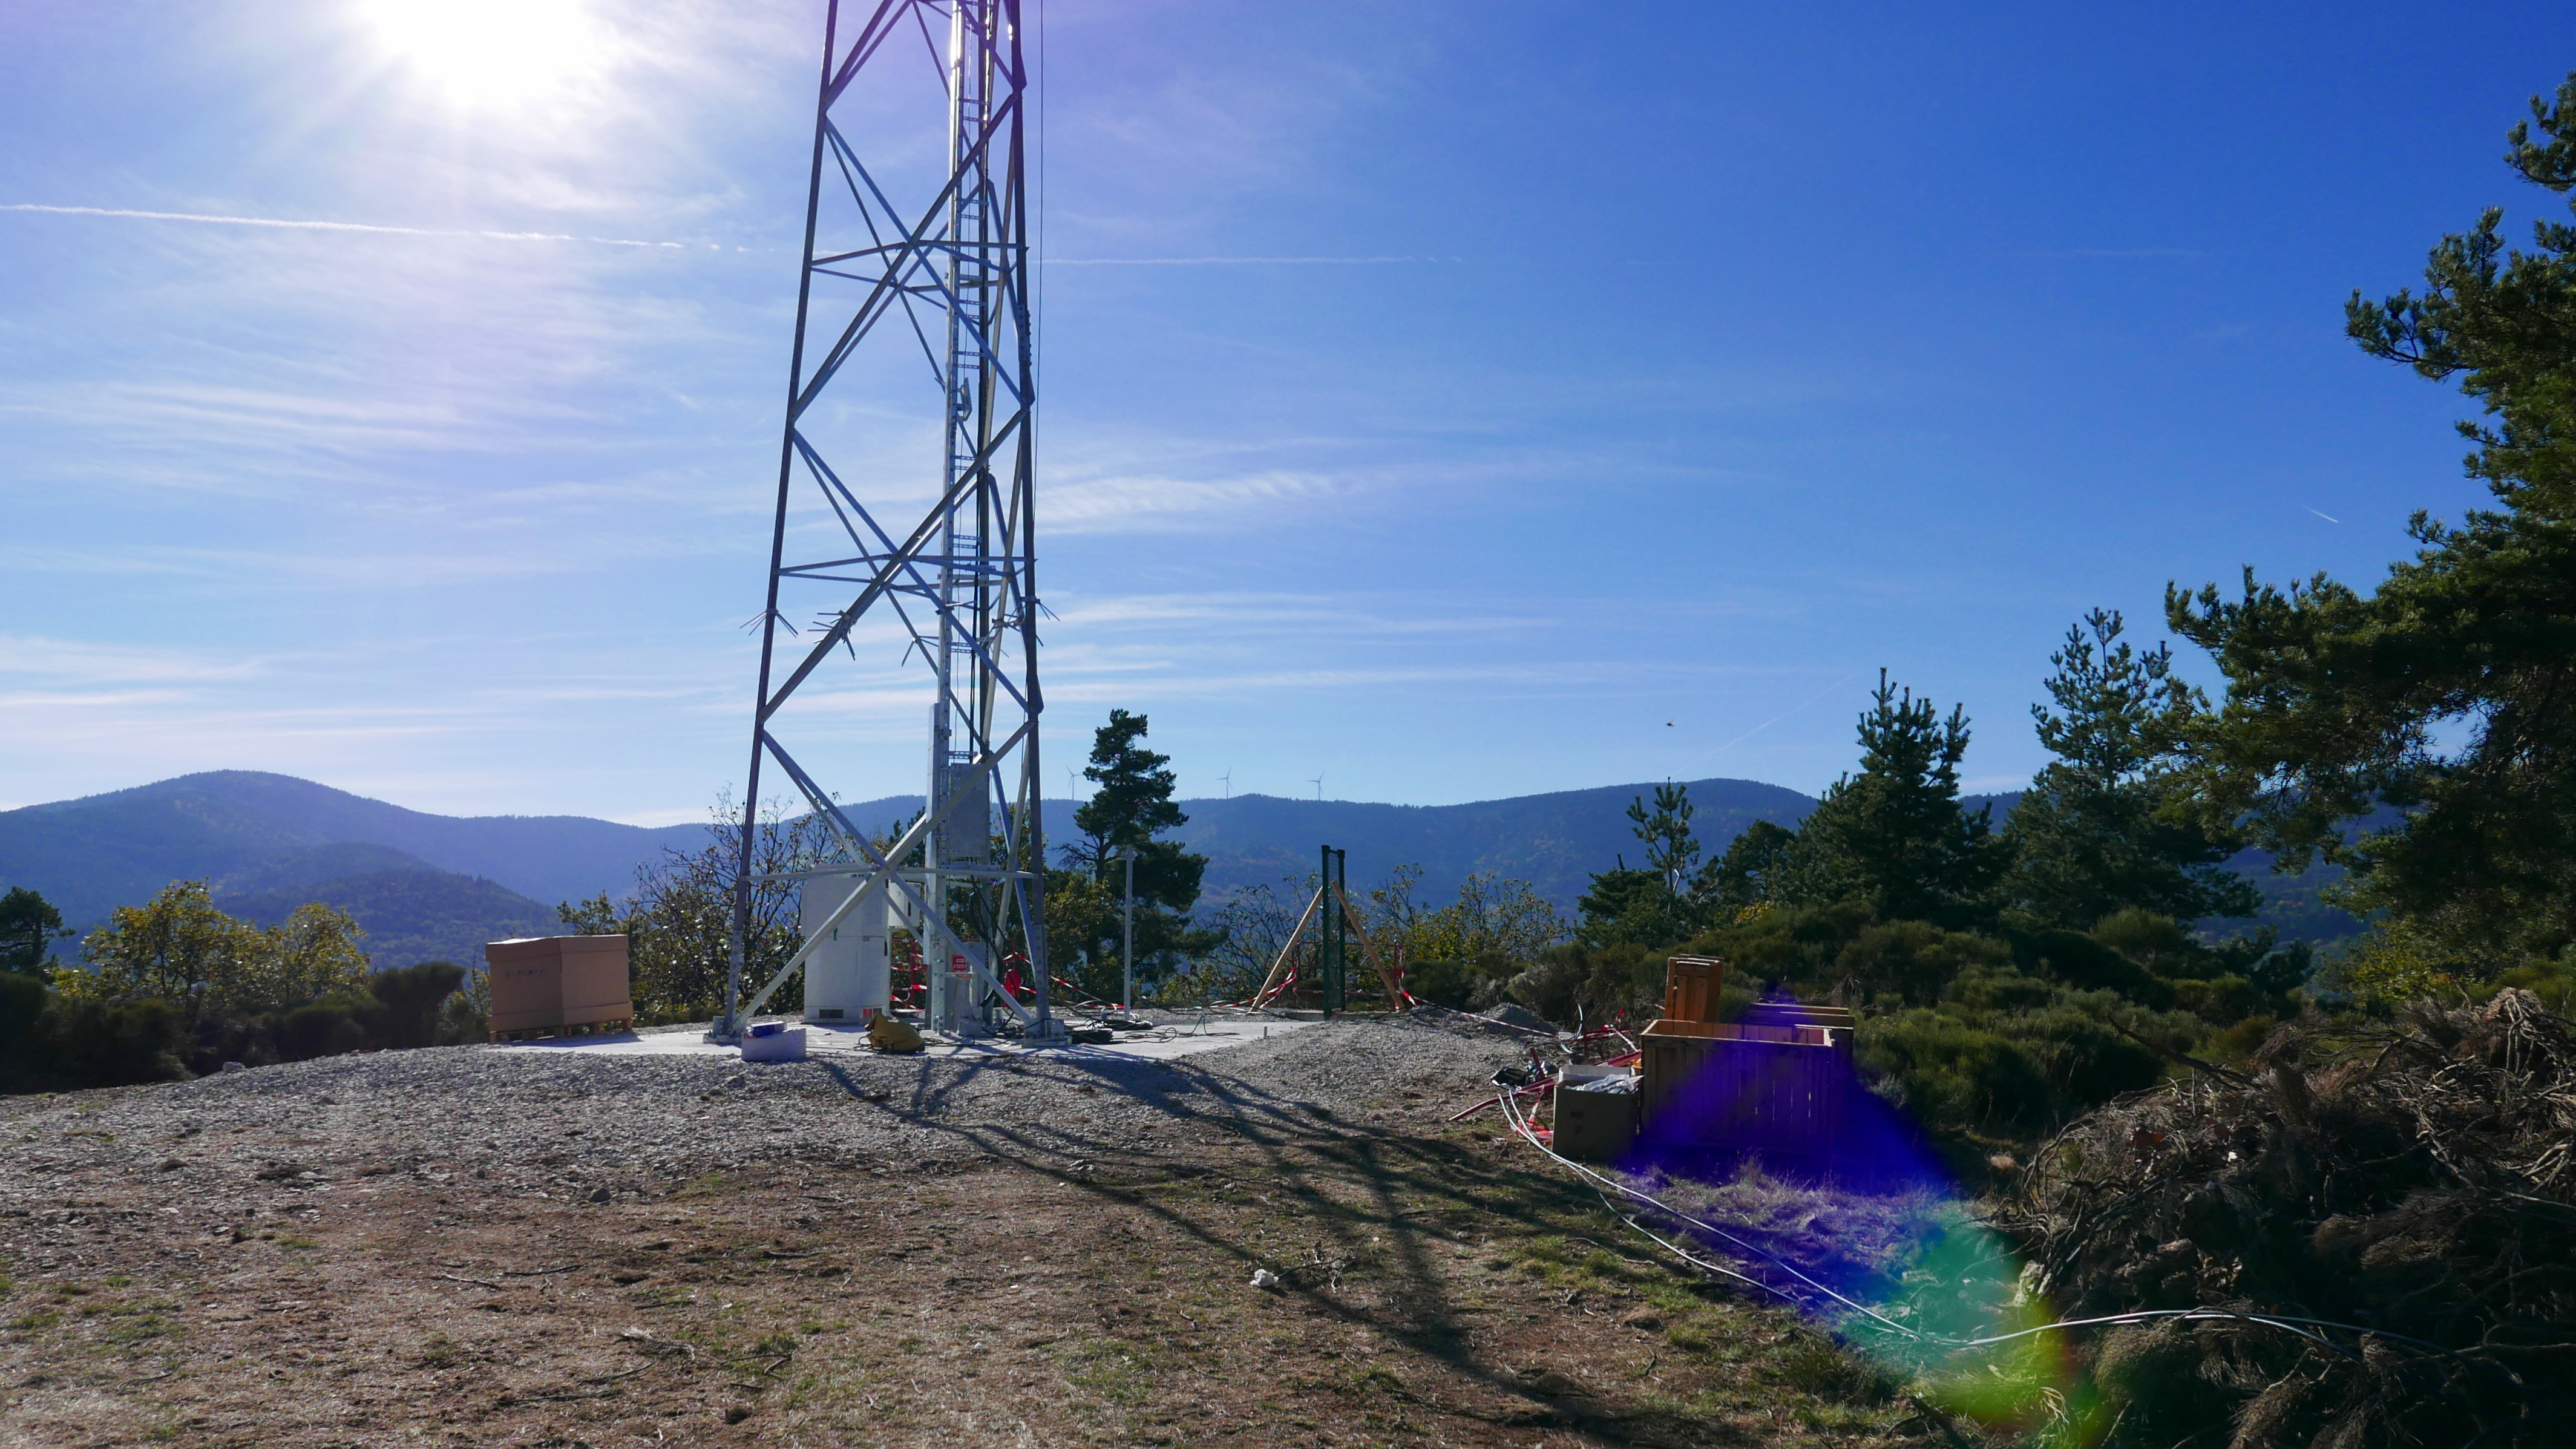
Case study : Greening Datacenters in Marseille
Tip
This case study is based on a citizen investigation led by the collective “La Quadrature du Net”.
In response to growing concerns about water and energy usage, some data centre providers are adopting new techniques and communicating about them extensively. Let’s take a closer look at the “river-cooling” technique used by Digital Reality for its data centres located in Marseille port datacenters located in Marseille port.
In response to the increasing number of data centres being deployed in Marseille, and to what is considered to be ‘greenwashing’ communication, a group of activists have published an investigation into the environmental impacts of the data centers of Digital Realty in Marseille Port. Their analysis of ‘river cooling’ offers a critical view of the provider’s official communication.
The ” Galerie à la Mer”, built in 1905, is a mine drainage galery that evacuates the overflow of water from the former coal mines of the neighboring town of Gardanne, located north of Marseille. This overflow water is discharged into the Mediterranean Sea at Cap Pinède in Marseille. Managed since 2007 by the Bureau de Recherches Géologiques et Minières (Office of Geological and Mining Research, BRGM), the national geological survey authority, the Gallery consists of an upper section, used to evacuate drainage ferruginous water from the former mine to the sea, and a lower section, known as the “cunette”, a drain pipe, which collects and evacuates rainwater runoff and infiltration water from the nearby Massif de l’Étoile. According to the final report document provided by the public inquiry commissioner in 2018, the water in this drain pipe is of “very good quality” and “drinking quality” water that can therefore be used for the population or as a strategic reserve in case of need, in a region prone to droughts.
The authors of this investigation highlight a conflict over the use of drinking water in a context of growing tension over this resource. Authors also highlight another conflict over access to electricity in the port of Marseille. The electricity needs of data centres are hindering the electrification of the city in particular the port. Indeed, electrification is an important transition lever in supporting the electrification of maritime transport, a major source of air pollution in Marseille, that could be responsible for 2,500 deaths per year in the city..
In this regard, a quote from Fabrice Coquio, the CEO of Digital Reality France, reported in an ADEME expert report, is particularly striking. Jean-Claude Gaudin had to negotiate to get back 7 MW “because they had forgotten to reserve them for their electric buses”.
Activists also point out that heat dissipation in this urban area contributes both to sound pollution as well as a local warming of the city, which are already subjected to regularly heat waves.
Finally the authors also call into question the accuracy of Digital Reality’s forecasts, pointing out the discrepancy between the anticipated water discharge temperatures in the initial project reports (23.4°C) and the actual measurements taken (27°C). Consequently, the risks to flora and fauna, particularly the risk of eutrophication, remain largely unknown. This all calls into question the official communications from data centre providers on environmental issues. This is particularly significant given that the MRS3 data centre was recently issued with a formal notice due to a refrigerant gas leak, which is a potent greenhouse gas.
Considering further that, given the absence of a leak detection system on the equipment, which by regulation alerts the operator or a maintenance company when a leak results in the loss of at least 10% of the charge of fluid contained in the equipment, does not allow the operator to implement corrective actions limiting the emission of greenhouse gases into the atmosphere, the operator must be required to take the necessary measures to prevent serious and imminent danger to health, public safety or the environment, in accordance with article L.171-8 of the Environment Code;”
Formal notice served on INTERXION FRANCE for its site known as MRS3 in Marseille (2023), available here
Analysis of this data centre shows the importance of going beyond official communications by adopting a systemic and situated perspective that takes into account the socio-environmental issues of the area where the data centre is located.
Power availability in Ireland
Like any industry, if data centers are too concentrated in the same area the power available on the grid becomes more scarce. For instance, Ireland has attracted many tech companies to set up in their territory, notably thanks to large financial advantages. The Irish Central Statistics Office estimated that data centers accounted for 11% of national electricity consumption in 2020 and 14% in 2021. The national electricity supplier estimates that at this rate data centers will represent 33% of Ireland’s electricity consumption by 2030. This growth is of course unsustainable for the energy provider Eirgrid and the latter has notably warned that it will no longer supply electrical power to new data center projects in Dublin until 2028. The place and importance of data centers is giving rise to important societal debates in Ireland and presages a larger problem of accounting between economic development, infrastructure management and climate policy.
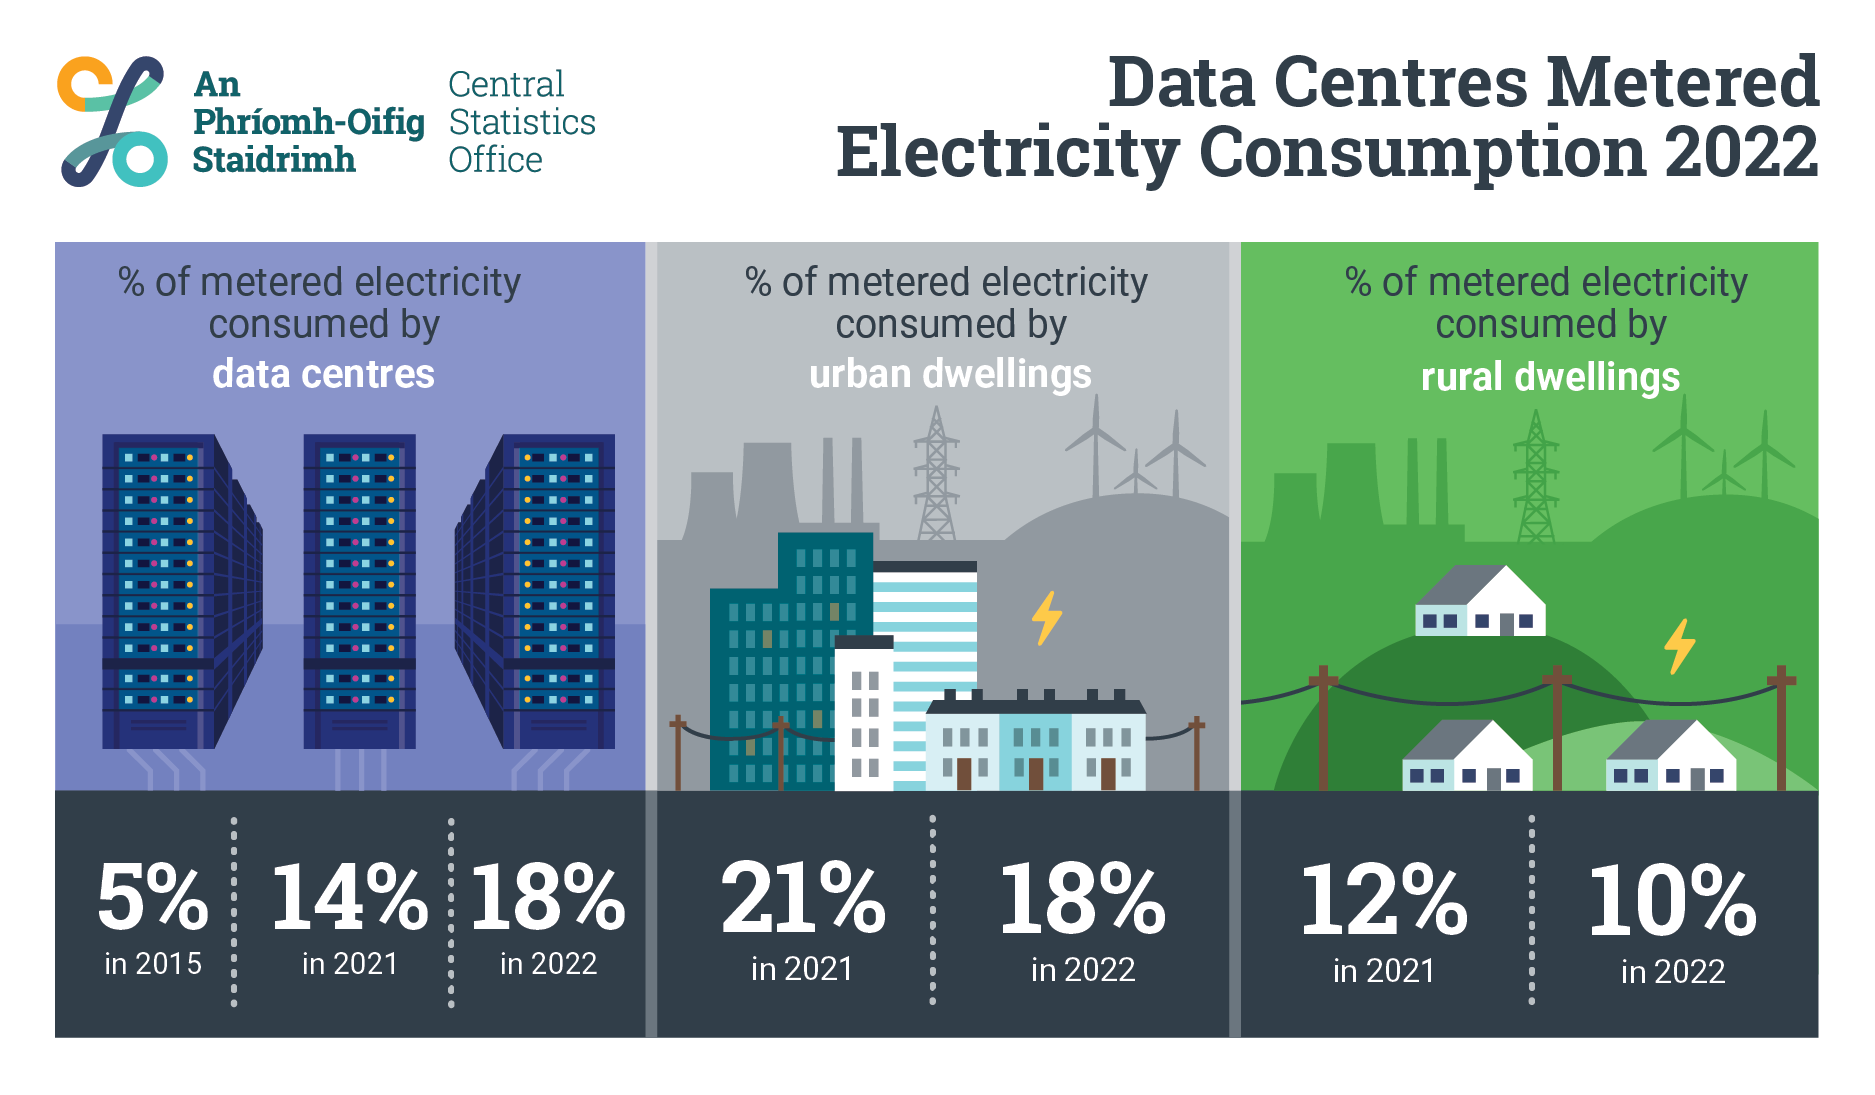 Data Centres Metered Electricity Consumption 2022 - Credits: Irish Central Statistics Office
This energy demand is also difficult to reconcile with the climate commitments which imply a reduction in energy consumption in absolute terms by 2050. For example, France must reduce its final energy consumption from 1600 TWh in 2020 to 900 TWh by 2050. However, the French energy network operator (RTE) estimates that electricity consumption by French data centres will increase threefold between 2020 and 2050. We still need to be sure that these infrastructures are worth the investment, enabling us to decarbonise other sectors of the French economy.
Water stress / consumption in the United States
In progress…
Case study: Semiconductor manufacturing in Taiwan
This session uses the research paper from Gauthier Roussilhe, Thibault Pirson, Mathieu Xhonneux and David Bol, titled: From Silicon Shield to Carbon Lock-in? The Environmental Footprint of Electronic Components Manufacturing in Taiwan (2015-2020) (Link to preprint).
Why Taiwan?
Over the last four decades, Taiwan has developed a strong ecosystem in semiconductor manufacturing, building a leadership position in packaging, foundries, and testing of integrated circuits (ICs). The island is a key provider of electronic components for the rest of the world with more than 63% of the 2021 worldwide output value ensured by Taiwanese IC foundries and 58% of the IC packaging. The electronics industry accounts on average for 30% of Taiwan’s exports and it is therefore not surprising that it significantly contributes to the economy of the island. In fact, Taiwan’s semiconductor industry has witnessed double-digit growth for three consecutive years and is forecasted to reach more than 170 billion US dollars in 2022. The Taiwanese government heavily relies on the electronics industry for the next decades, as it plans on establishing several semiconductor initiatives and R&D programs to support its growth. In parallel, the Taiwanese government has issued a carbon reduction plan called the Greenhouse Gas Reduction Action Plan, with the objective of decreasing their absolute carbon footprint at the 2050 horizon. Yet, Taiwan has been struggling with the effective implementation of this plan and actual carbon reductions are still to be realized. As the production of electronic components is known to be energy and resource-intensive, their environmental impacts cannot be ignored.

Western economies as both the USA and the European Union (EU) are currently massively investing to relocate the manufacturing of advanced manufacturing processes in their own territory (European Chips Act). It is clear that the EU aims at fostering a large digital innovation capacity based on a resilient semiconductor ecosystem. A key policy objective is to eventually bridge the gap from lab to fab by producing CMOS chips in European foundries in order to secure its electronics supply chain and boost its competitiveness through digitalization. This is further supported by the recent chip shortage which revealed the increasing pressure on our production systems. Analyzing the current Taiwanese situation can provide a good estimate of the environmental impacts associated with the development of current and future state-of-the-art electronic components, given that more than 90% of the worldwide sub-10nm integrated circuits (ICs) are currently manufactured in Taiwan at TSMC, the de facto world leader in advanced ICs manufacturing.
Making electronic components
Before going any further it is necessary to have a basic understanding of what electronic components are and how they are made. Electronic components are generally classified into different families according to their function and physical properties. There are many ways of classifying them but there are three main categories: active components (diodes, transistors, ICs, optoelectronics, displays), passive components (resistors, capacitors, sensors, etc.) and electromechanical components (switches, fuses).

Close-up of a microcontroller (left) and side view of a microprocessor (right) - Credits: Eric Schlaepfer and Windell H. Oskay
Within the integrated circuits there are still different families, called logic, i.e. with logic/electronic gates (diode/transistor/resistor logic). The integrated circuits that interest us are the CMOS (Complementary Metal Oxide Semiconductor) logic components used for microprocessors or memory components.
Manufacturing process for ICs
Processors are etched on silica disks, called wafers, doped with another element (e.g. Boron) to modulate their electrical and structural properties. The electronic circuit patterns are affixed to masks that guide the etching, like the negative of a photograph. A wafer allows many circuits to be etched at once, and these circuits are cut with a saw. They are then packaged, i.e. the component connectors are plugged in and tested, and placed in a plastic frame to prevent damage. These components are then sent downstream to the other industries to be soldered onto a circuit board.
Simplified processes for making ICs, see high-res [here](https://gauthierroussilhe.com/en/resources/la-fabrication-de-composants-electroniques)
The machines that allow this type of production are very expensive, especially those for engraving. Every year manufacturers produce smaller transistors and can therefore fit more on the same surface. The more transistors there are, the more computing power there is. Today, the most advanced methods engrave at 5nm (the distance separating each transistor from the other) but the physical limit is 2nm and we will reach it within a decade. Today, there is only one type of process that allows us to etch below 7nm, and that is Extreme Ultra Violet. Only one manufacturer produces machines using this process, ASML, and 90% of the production capacity below 10nm is located in Taiwan
NXE:3400 machine from ASML
Looking at Taiwan’s electronic industry
The manufacturing of the electronic components under study implies complex supply chains with several actors located in different countries. The chain could be divided in two main parts, the front-end and the back-end processing. […] As a first step to map this complex ecosystem, we narrow down the scope of this study by excluding back-end processing which is generally less impacting than front-end manufacturing. We further narrow the scope of this study by excluding design and raw material extraction as we focus exclusively on the environmental impacts of ECMs that are geographically located on the island of Taiwan.
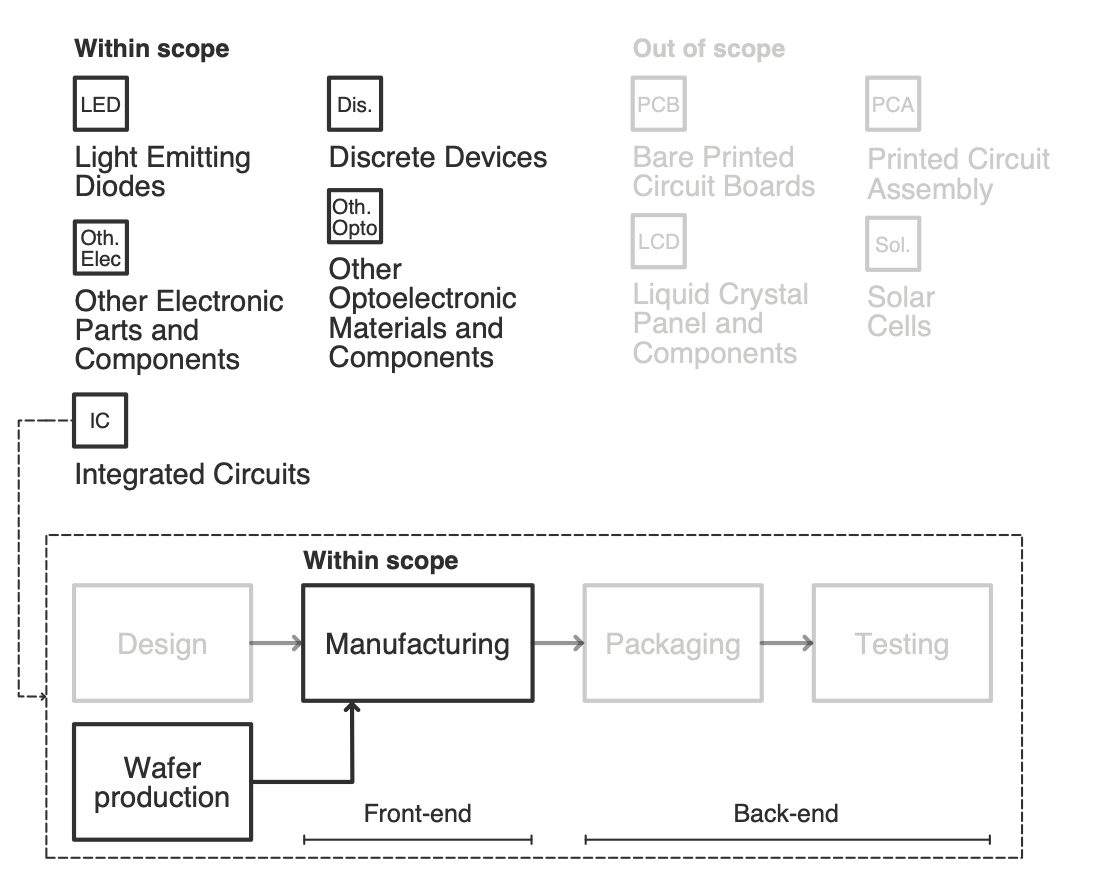
Simplified view of semiconductor manufacturing processes and the scope of the study (classification based on Taiwanese Indexes of production)
We consider in this study three indicators that quantify the main environmental impacts of ECMs: GHG emissions, final energy consumption, and water usage.
Results
The data shows a strong 43.3% increase of GHG emissions during the period 2015-2020 (+43.3%), which corresponds to a CAGR of +7.5%.[…] The final energy consumption of the 16 ECMs in our sample has increased by +18.4% over 3 years, corresponding to a CAGR of +8.8%.[…] The global volume increased by +34.4% over 6 years, corresponding to a CAGR of +6.1%.
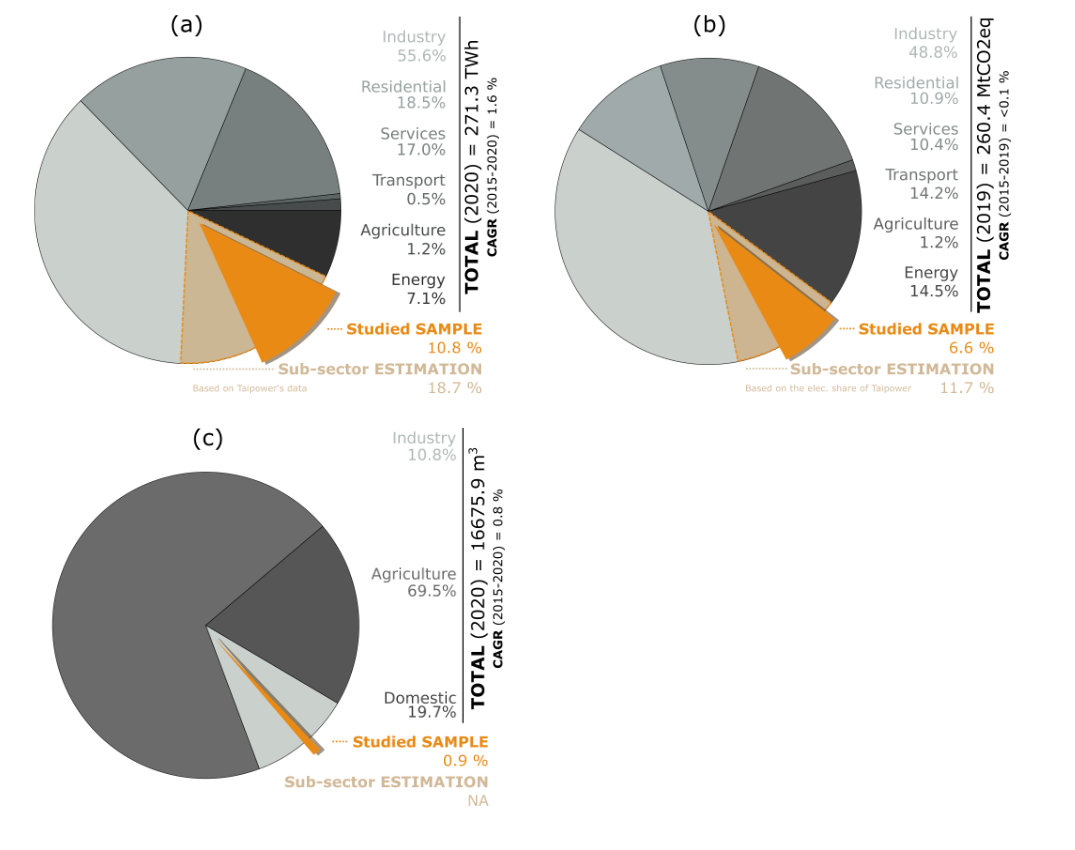
National shares of (a) electricity consumption, (b) GHG emissions, and (c) water consumption in 2020 for the different Taiwanese sectors. The contribution of the ECMs from our sample belong to the electronics sub-sector, which itself is part of to the industrial sector
The figure below depicts the normalized evolution of the three aggregated indicators and of the number of manufactured ICs in Taiwan from 2015 to 2020, according to data from the Taiwanese Ministry of Economic Affairs.
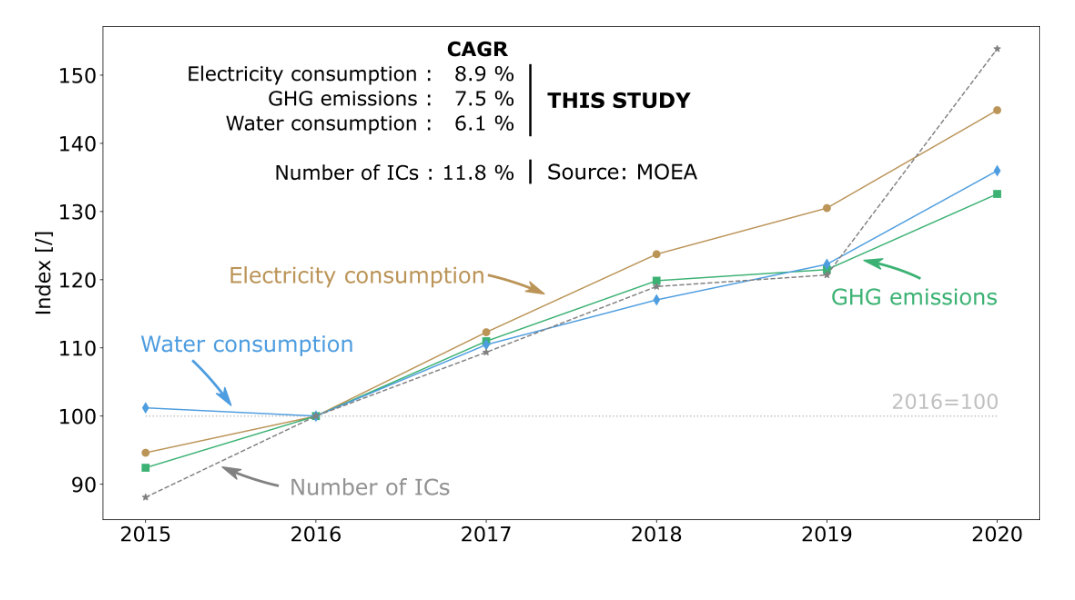
Evolution of the environmental indicators obtained in this study and of the ICs manufactured in Taiwan over the period 2015-2020. All data is normalized with respect to 2016, i.e., 2016=100
Territorial constraints
To further study the long-term sustainability of the Taiwanese electronics industry, we now analyze the territorial constraints of Taiwan regarding renewable electricity generation and water supply.
Up to 97.5% of Taiwan’s energy generation originates from imported carbon-intensive energy sources in 2020, including coal from Australia, Indonesia and Russia, crude oil from Saudi Arabia, Kuwait and US and liquefied natural gas (LNG) from Qatar, Australia and Russia. Regarding specifically the production of electricity, the Taiwanese government plans to phase out nuclear power and to produce 20% of its electricity from renewable sources by 2025, under the so-called 2017 Electricity Act. Yet, renewable energy represented less than 6% of the power generation in 2020. In fact, as of 2020, only 9.47 GW of renewable energy capacities have been installed in Taiwan (including 5.82 GW from photovoltaic power and 0.85 GW from onshore and offshore wind power). Renewable energies generated that year 15.12 TWh of electricity, whereas the sole electronics sub-sector consumed 50.73 TWh. Due to the limited usable space on the island, the Taiwanese government mainly counts on offshore wind turbines in the future, with a target capacity of 5.7 GW by 2025. Yet, by June 2021, only 0.13 GW have been installed.
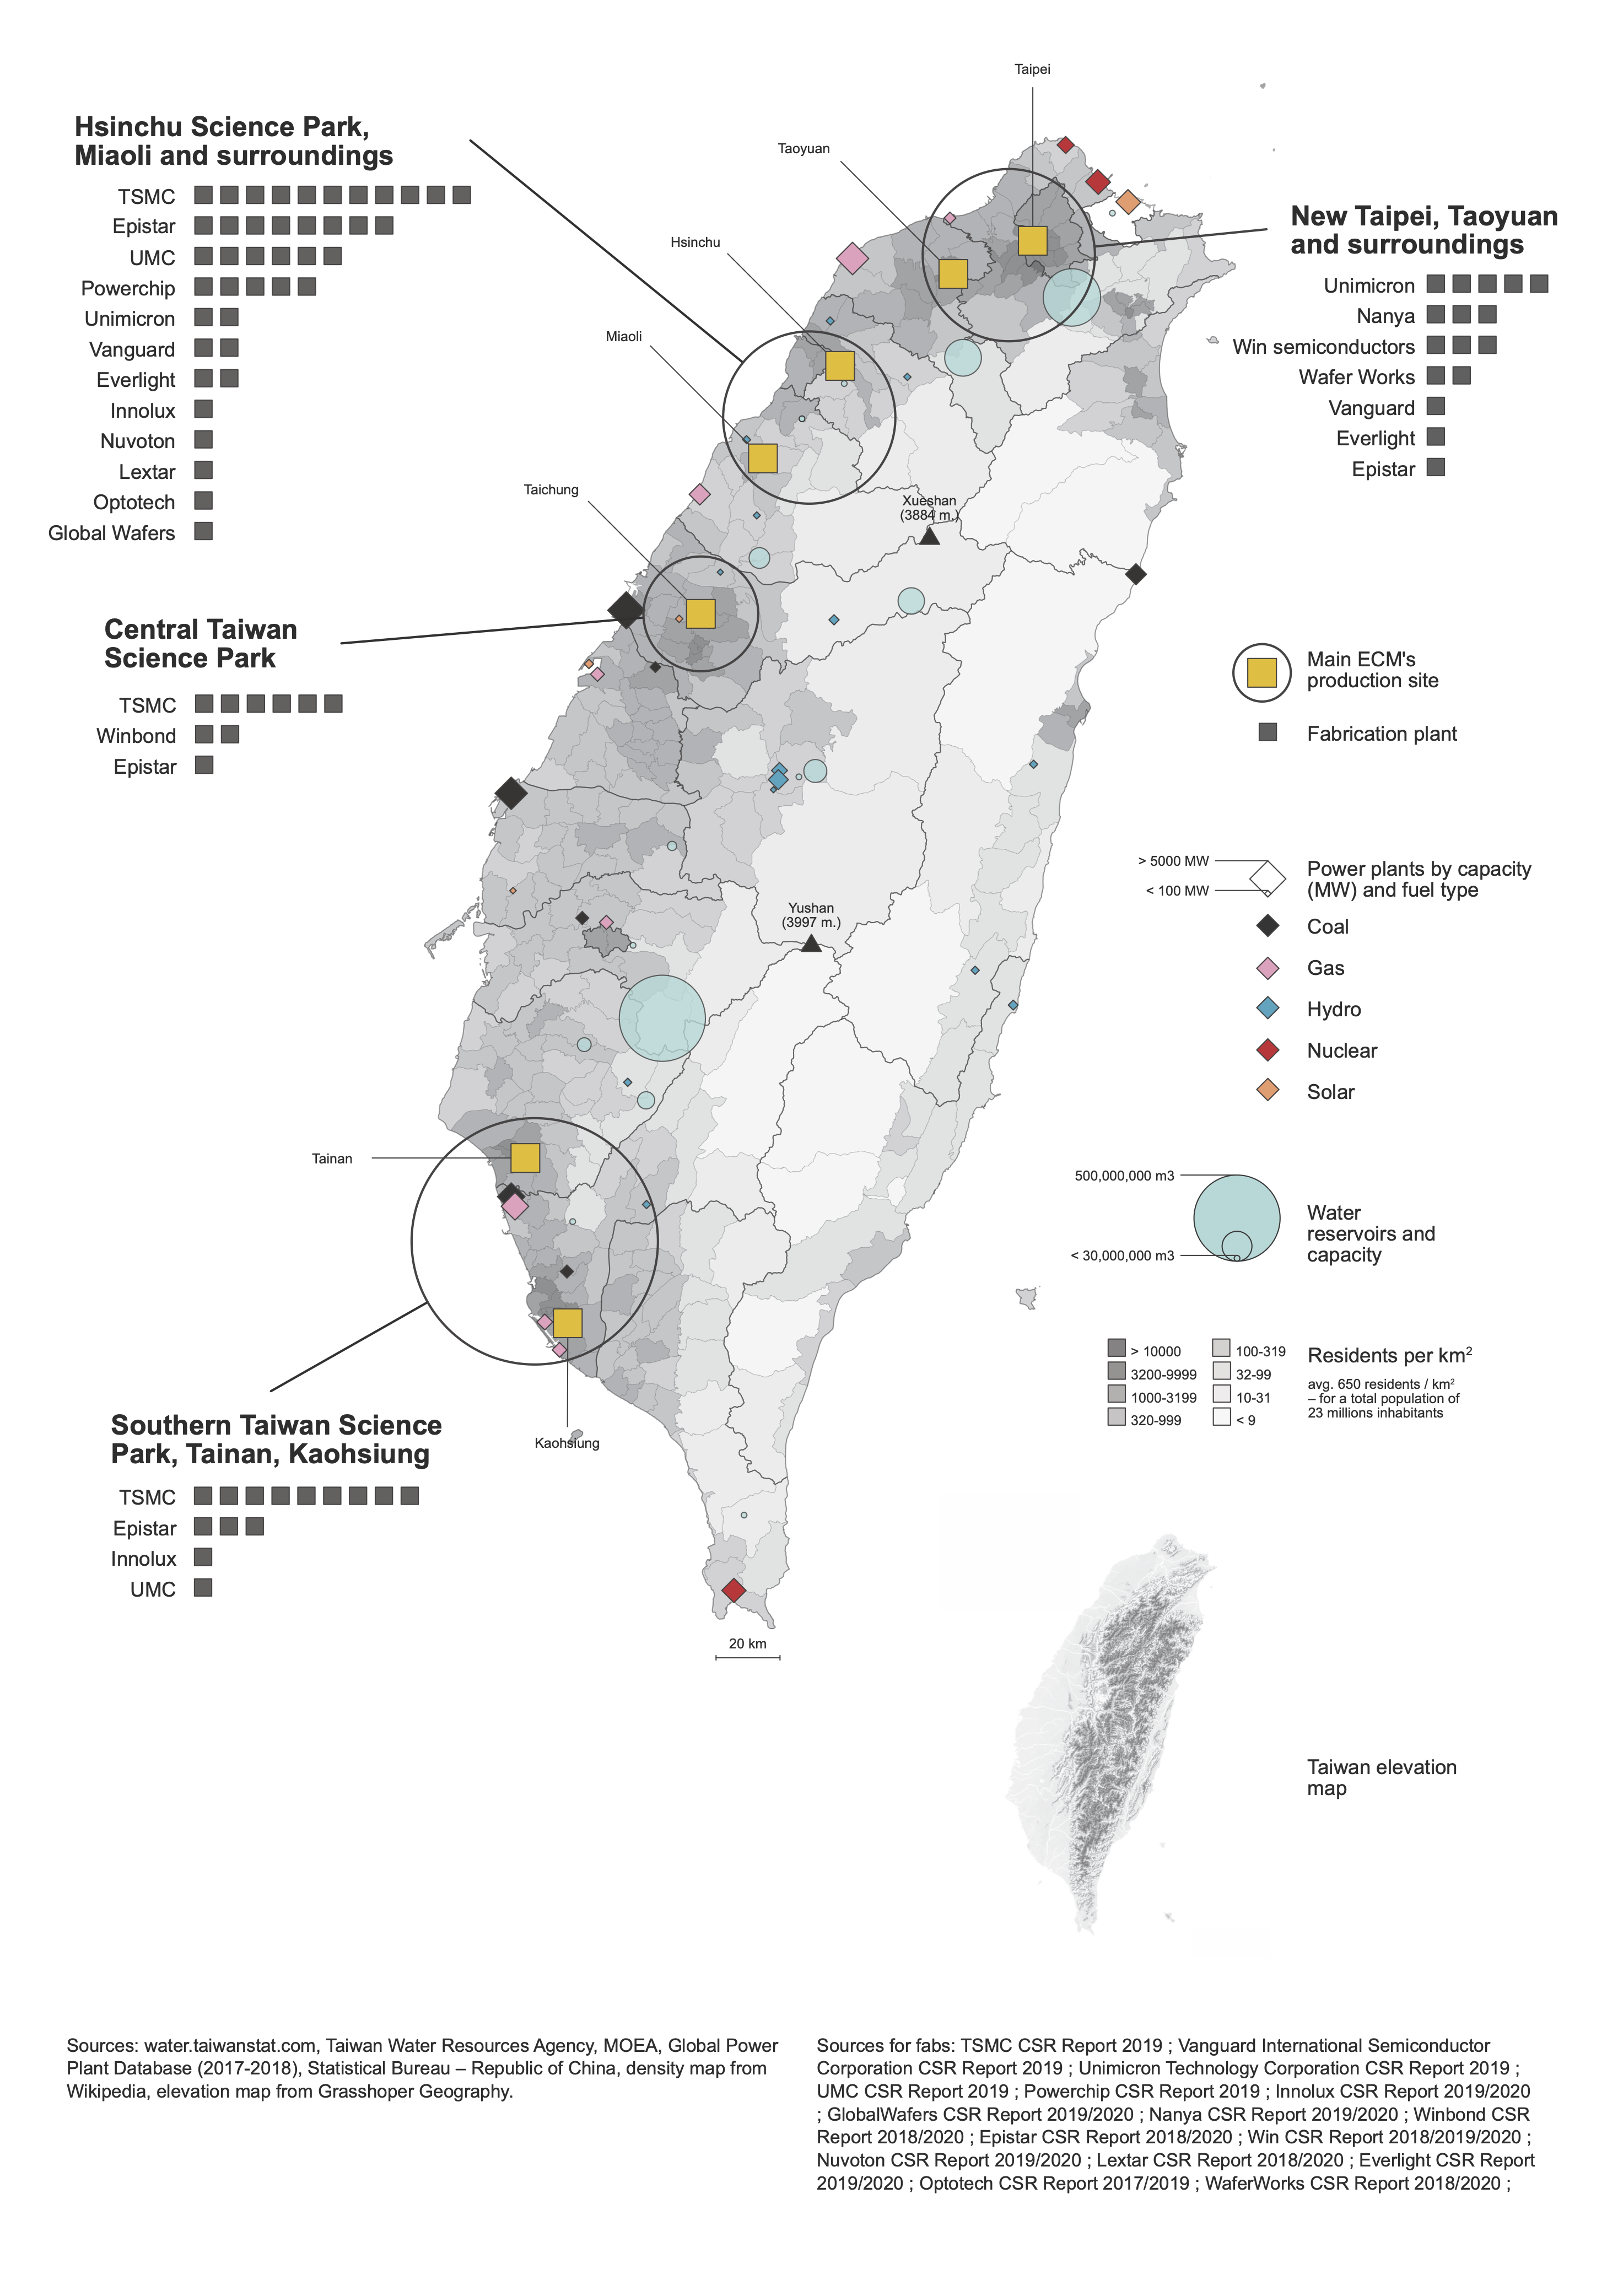
Location of companies considered in this study together with power plants and water reservoirs compared to population density
Even if ECMs do not represent a significant part of the national water intake, they rely on a limited number of reservoirs located in places of very high population density. For instance, TSMC’s factories in Hsinchu Science Park use 10.3% of the daily supply from Baoshan and Second Baoshan reservoirs whereas those located at STCP (Southern Taiwan Science Park) use 5.3% of the daily supply from Nanhua and Zengwen reservoirs. This concentration has already led to supply issues during droughts. In 2020, the island faced a drought caused by the absence of typhoons in the previous year. If ECMs were already facing stress in the water-intensive production chain, this drought seriously amplified the crisis in this key sector of the island. Indeed, TSMC relied that year on hundreds of water trucks to maintain its water supply while several restrictions where being taken at the national level. In this sense, Taiwanese ECMs share a liability regarding water supply due to the increasing and spatially concentrated demand in the Science Parks.
Carbon reduction roadmap
The Taiwanese roadmap draws a GHG reduction roadmap up to 2050 which motivates a long-term projection in this case. Here, we only use conservative assumptions to design these scenarios. We do not assume improvements or degradation of the efficiency of manufacturing processes, since such hypotheses strongly depend on the type of products that are considered. In addition, the scenarios use the 2020 values from our sample of 16 ECMs, and not the extrapolated value for the whole sub-sector. […] The results point out the inconsistency between the GHG emissions from the electronics sub-sector and Taiwan’s GHG roadmap. Indeed, following the different scenarios, at least 15% to 37% of the 2050 carbon budget would be allocated to the manufacturing of electric components. These percentages should even be revised upwards when considering the entire sub-sector. In all cases, our analysis clearly highlights the difficult upcoming political arbitrations that will be needed if ECMs cannot decrease their GHG emissions.
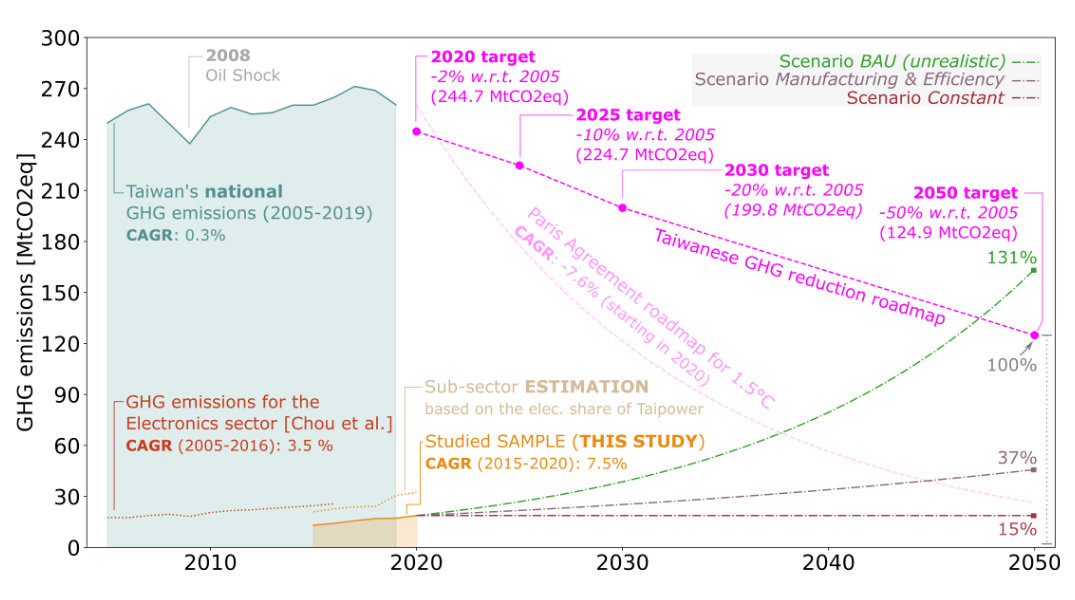
Scenario analysis for ECMs’ GHG emissions in Taiwan from 2020 to 2050. Perspectives regarding the national GHG emissions and the Taiwanese carbon reduction roadmap. The share of each scenario with respect to the total carbon budget in 2050 is given on the bottom right
Towards a Potential Carbon Lock-in
A carbon lock-in describes a situation where, in a ecoomical context of returns to scale, both public institutions and private actors (which constitute, with the deployed technological infrastructure, a techno-institutional complex) drastically inhibit the competitiveness and roll-out of low-carbon alternatives.
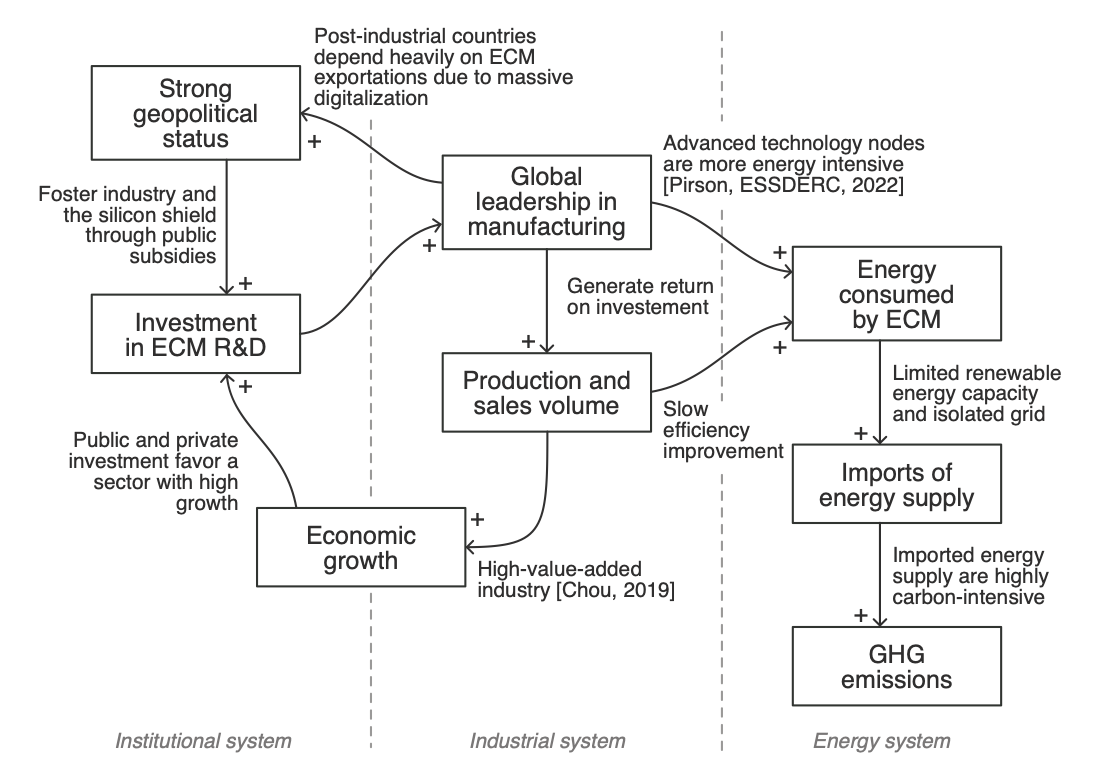
Illustration of the techno-institutional complex fostering a lock-in on carbon-intensive energy sources
We first point out that the Taiwanese geopolitics and economy are mostly centered around its electronics industry. The Taiwanese silicon shield is a well-described geopolitical strategy against the ambitions of mainland China on the island. This strategy relies on being a worldwide leading supplier of electronic components, enabling to seek the military protection of the United States. To reach this crucial leading position, the Taiwanese government fostered the electronics industry by creating the original model of Science Parks, and keeps to heavily subsidizing it. In return, leading Taiwanese ECMs have also committed substantial investments, e.g., TSMC is investing up to 44 billion USD in 2022 to increase production and R&D efforts. Yet, the technological path towards advanced sub-10nm technologies also implies new industrial processes such as EUV, which in turn are likely to increase the environmental footprint and energy consumption of the industry (the energy consumption from EUV processes is more than ten times that of deep ultraviolet (DUV) processes). At the same time, the territorial analysis previously discussed showed the difficulties for Taiwan to conduct a large-scale deployment of renewable energies in the short and medium-term. We therefore expect that a further grow of the production volume of ECMs will require increasing imports of high-carbon energy supplies. When considering these interactions together, it becomes apparent that the Taiwanese electronics industry is fated to remain a major contributor of GHG emissions.
Lessons to be learned
The Taiwanese case is specific to an industrial/economic development and a geopolitical context. Thus, the lessons to be learned from this case study need to be carefully selected. Firstly, Taiwan reminds us that even in a carbon neutral world there will be carbon-intensive zones. Secondly, it shows the fragility of our electronic production chains, both environmentally and climatically, and geopolitically, as a war in Taiwan would block the global production of new generation chips. Finally, it also leads us to ask whether the technological development path chosen is the most appropriate for the new situation on Earth. For the moment it seems not.
Resources
Syllabus
- Nikkei Asia, How Taiwan became the indispensable economy
- Gauthier Roussilhe et al., From Silicon Shield to Carbon Lock-in? The Environmental Footprint of Electronic Components Manufacturing in Taiwan (2015-2020)
To go further
- David Bol et al., Moore’s Law and ICT Innovation in the Anthropocene, IEEE Design, Automation & Test in Europe Conference & Exhibition (DATE), 2021
- Paul E. Ceruzzi , Moore’s Law and Technological Determinism: Reflections on the History of Technology, Technology and Culture 46, n. 3, 2005
- Financial Times, The big question of how small chips can get
- Susannah Glickman, Semi-Politics
Recycling facilities for electronic waste in Belgium
In progress…
Case study: Does Vinted help the environmental transition of the textile sector?
Tip
This case study is based on an academic publication.
Established in 2008 in Lithuania, Vinted is a leading second-hand clothing resale platform currently operating in Europe and Northern America. Beyond enabling cost savings for customers and additional income for vendors, the company emphasizes its environmental benefits as a key commercial argument. Vinted claims to reduce GHG emissions by encouraging the purchase of second-hand clothing thereby avoiding the production of new clothes. This assertion assumes that the emissions avoided compensate for the additional emissions due to the transport of parcels and the operation of the Vinted platform and organization.
In 2021, Vaayu, a consulting firm specialized in the environmental assessment within the textile sector, conducted a net impact study (focusing on GHG emissions) on behalf of Vinted. Based on a “net impact methodology” and using primary data collected through survey and transaction analysis, the study states that Vinted has avoided 453 kiloton CO2eq. in 2021. This figure is obtained by comparing, for each transaction, a scenario where items are purchased on Vinted platform with a scenario involving the acquisition of new items.
However, buying second-hand items doesn’t always displace demand for brand-new clothes. Indeed, Vinted creates new demand, whether because second-hand items are cheaper or because Vinted uses design patterns to encourage impulse buys. These effects could be referred to as ‘rebound effects’.
The study claims that these rebound effects were taken into account. In particular, they evaluated the proportion of purchases that could be considered ‘impulsive’ by asking customers if they would have bought the same item new if Vinted hadn’t existed.
However, several limitations appear in this study, hindering the quality of the results. Notably, significant documented effects were excluded from the analysis. One example is the reinvestment of money earned on Vinted through selling into fast fashion items, which fuels the vicious circle of the fast fashion industry. We could also mention social effects, such as the tremendous reduction in donations to charities induced by a change in customer behaviour from donating to selling, which has put those charities in great difficulty.
Ubiquitous digital platforms like Vinted also operate deep societal transformations that cannot be acknowledged by comparing scenarios at the scale of one transaction. For example, some scholars have noted a shift in some sellers’ practices towards a ‘consu-merchant’ (i.e. a blurring of the distinction between consumer and vendor).
Such criticism should encourage us to carefully scrutinise the tech companies’ claims and adopt a more systemic approach. This will enable us to acknowledge the dynamics induced by the deployment of such solutions in more depth, and make the most relevant decisions to encourage their beneficial effects and constrain the detrimental ones.
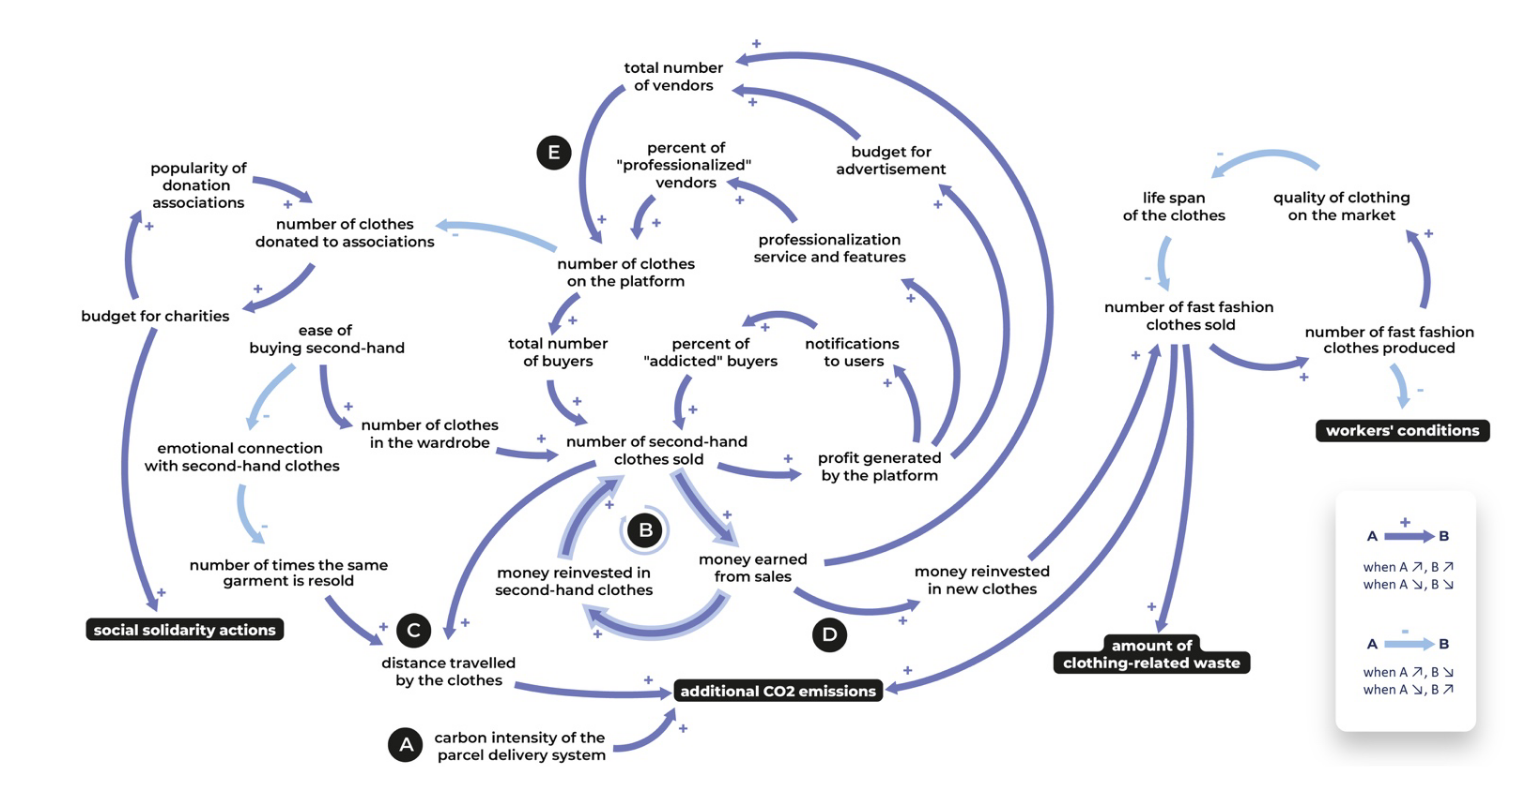
Case study: Producing environmental data on the material backbone of genAI
Tip
This case study is based on an academic publication.
GPUs form the material backbone of genAI. They are specialised equipment designed for matrix calculations, such as those performed during the training and inference of neural networks. In this case study, we will examine the production of an environmental account of GPUs in the context of a lack of transparency from manufacturers.

Hunting for GPUs
The first step of this study was to search for GPUs. This was a difficult task since these devices are worth tens of thousands of dollars, are in short supply, and are subject to various regulations (waste regulations, the US ban, etc.). Several techniques were employed, including acquiring a second-hand card on Chinese eBay and extracting a broken card from a major cloud provider with the help of an informant within the company.

Dismantling GPUs
As Nvidia does not provide detailed documentation on the composition of these cards, we had to dismantle them and document their composition using a reverse engineering method.
Identify, count, measure, weigh
Documenting the composition of a card involves identifying and counting its components, and describing each one by its shape, type and weight. This is a very meticulous process, since the components are sometimes very small.
Dissolving GPUs
However, some characteristics remain out of reach. Indeed, most components are encapsulated in an epoxy (plastic) package, which does not allow the die (integrated circuit) inside to be documented. The size of the die in particular is mandatory for assessing its impact. To overcome this limitation, practitioners usually make assumptions. However, since the size of the epoxy package is not proportional to the size of the die, these assumptions are often very inaccurate.
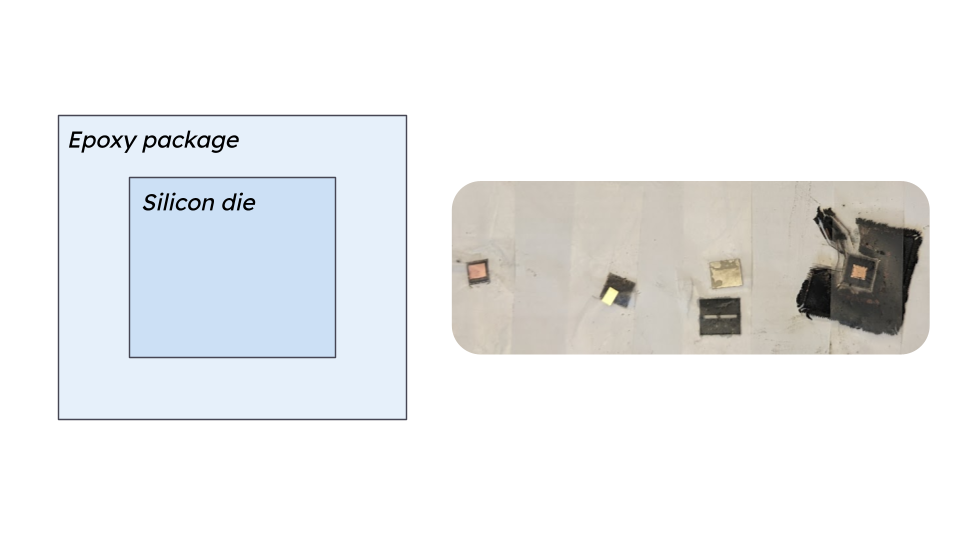
To obtain more precise measurements, we dissolved the package in acid to reveal the die inside.
Crushing GPUs
By documenting the technical characteristics of the cards, we were able to assess the environmental impact of manufacturing the devices. However, to obtain a more precise account of the impact of upstream processes such as mineral and metal mining and purification, we needed to determine the elemental composition of the cards.
To obtain this, we crushed the card in an industrial grinder, burned the dust to remove the organic matter (plastics) and passed the remaining dust through a spectrometer.
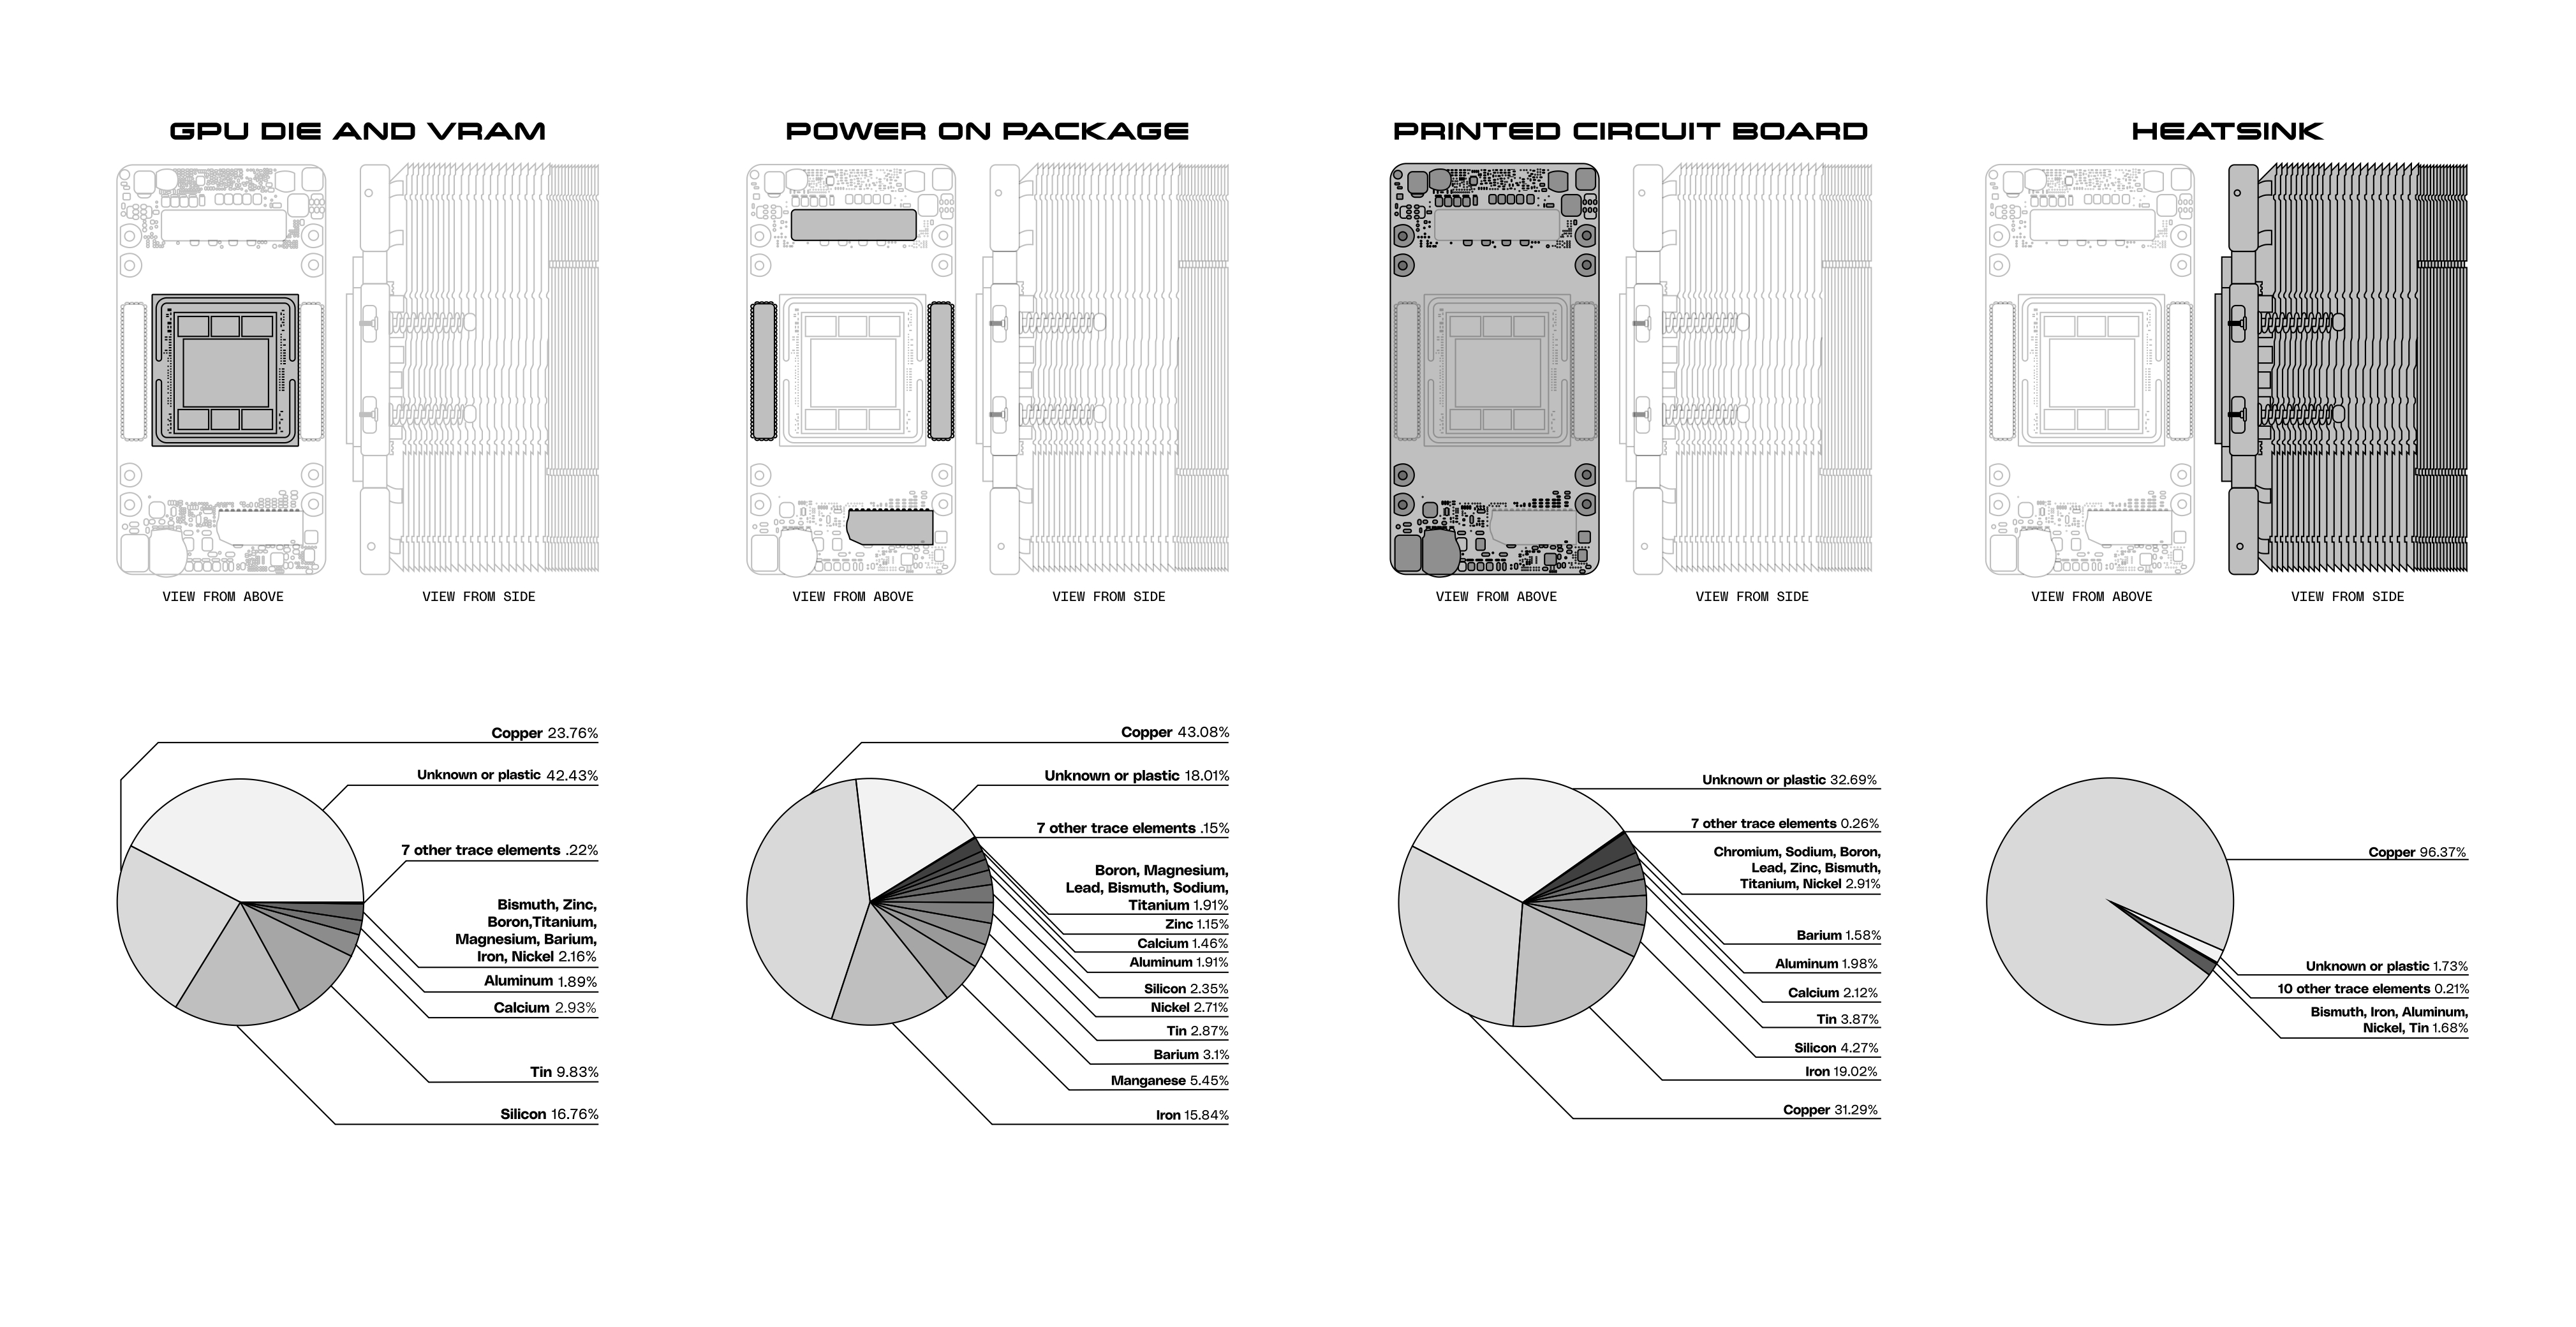
Translate into environmental data
All the data we created constitutes the inventory of our environmental analysis. To translate this data into environmental figures, we used an LCA database which lists the environmental impact of sub-processes, such as producing 1 kg of copper or manufacturing 1 cm² of wafer using 3 nm technology.
Using LCA software, we convert our inventory into a comparable environmental account expressed in kgCO₂eq, m³ of water, MJ, and so on.
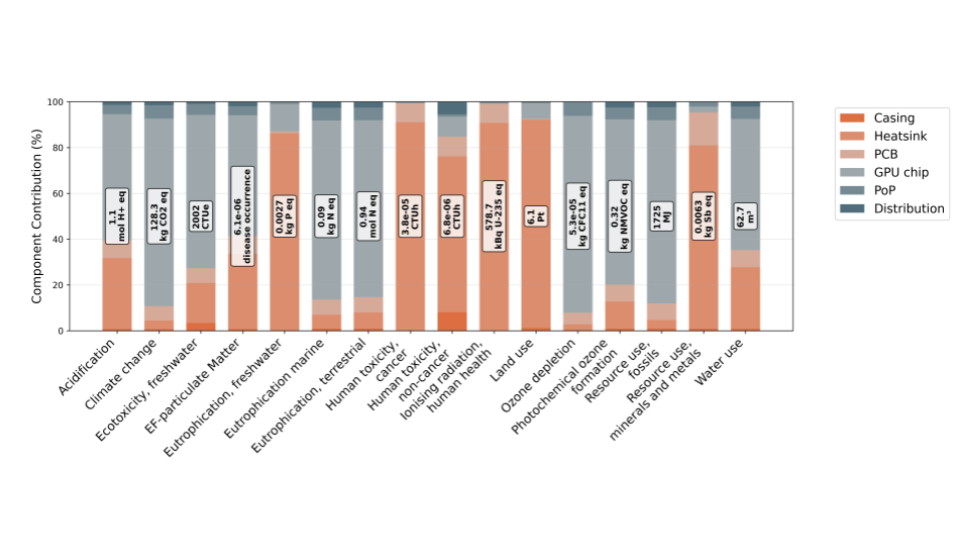
Conclusion
This case demonstrates the opacity of manufacturers of digital equipment, particularly in the genAI sector. It also shows the amount of energy and resources needed for the research community to create environmental accounts using reverse engineering techniques, resulting in a basic and imprecise, yet transparent, figure regarding the impact of such important equipment on the genAI value chain.
Case study: GenAI vs. illustrators - the battle of carbon
Tip
This case study is based on an academic publication.
This case study aims to show how the ecological benefits of digital technologies are often justified using highly criticisable quantitative assessments. It also illustrates how such techno-optimist narratives can be established through (pseudo)-academic publications.
A study
In 2024, a group of researchers working on the sustainability of ICT published an article called ‘The carbon emissions of writing and illustrating are lower for AI than for humans’. This paper was published in Nature Scientific Reports, a review journal that benefits from the well-known Nature brand but has a much lower scientific quality.
In this article, with a very transparent title, the author argues : “We found that, for these two activities [Writing and illustrating], at least, AI has a substantially lower carbon footprint than humans engaged in the same task”. In sum, to be sustainable, companies should use genAI instead of humans to produce their content.
An authority argument
That was all it took for this argument to become a key point cited by advocates of genAI. The following tweet by Yann LeCun, a Turing Award winner (the equivalent of the Nobel Prize in computer science) who at the time was Meta’s chief AI scientist, illustrates how the paper’s conclusions were used to defend the technology.

Counter-attack from academia
However, this study suffer some major methodological problems :
Fallacious counterfactual reasoning: Such ‘net impacts’ studies are comparative by design, they compare the carbon footprint of an LLM task with that of another (human-based) task. However, in this case, all the carbon footprint associated with humans was included, including feeding, housing and transportation. In other words, AI would truly avoid the impact of humans if illustrators and writers were to disappear.
Omissions : On the other hand, several impacts of AI were omitted from the analysis, including the embodied impacts of the materials used by the LLM (e.g. raw material extraction and purification, manufacturing, transport and disposal), or the technical environment in which the model is hosted.
Incorrect comparison: When comparing two processes, it is important to ensure that they produce similar outputs. However, Tomlison et al. (2024) considered that only one prompt was needed to generate an image or text of the same quality as human-based production, which typically requires several attempts.
Reductionism: While Tomlison et al. (2024) consider the beneficial indirect effects of deploying genAI to avoid the impacts of human-based tasks, they do not consider all the ripple effects induced by such an action. For example, even if prompting AI was more ecologically efficient, it has been documented that AI has increased the generation of illustrations by making them far more accessible. This is a classic example of a rebound effect.
This counter argumentation was point out by several publication published 2 years later. Correcting the main error of the publication without considering the indirects effects of AI, Cook et al. (2025) concluded that the net impacts of genAI use compare to human illustration or writing was highly sensitive to methodological choice and could be positive or negative depending on the accounting choices.
In a direct response to the paper sent to the editor by Bol et al. (?)… TBD
As you can see, it would have taken the academic community at least two years to publish a counter-study with as little hope of being heard as the original paper. Today, the original paper has been cited 169 times, while Cook et al. (2025) have been cited twice, and Bol et al. are still in the editorial process…
Resources
Syllabus
- Joseph Cook, Romain Jacob, Jo Lindsay Walton, Adrien Berthelot, Asim Hussain, et al. Beyond Counting Carbon: AI Environmental Assessments Struggle to Inform Net Impact Decisions. 2025.
To go further
Case study : Exploring the consequence tree of teleworking
Consequence trees are a structured format that illustrates the direct and indirect effects of a solution in the form of causal chains. The solution is the root of the tree, with the branches illustrating the indirect effects until the endpoints are reached. These endpoints represent environmental charges and benefits.
We have conducted over twenty studies involving the creation of consequence trees. Here, we propose exploring one of these consequence trees in relation to teleworking in France.
Teleworking was one of the first digital use cases considered as an opportunity to address environmental challenges. Since the energy crisis of the 1970s, teleworking has been considered a way to reduce our dependence on and consumption of fossil fuels by avoiding commuting. However, as we will see, the picture is much more complex.
Activities
Activity: Technological failures
Duration : 10 mins
Format : Group work
Group constitution : 2 to 3 persons
Search and pick a digital technology that was pushed by tech companies but failed, and discuss the reasons for its failure.
Ressources
-
Killed by Google : https://killedbygoogle.com/
-
Museum of failure : https://museumoffailure.com/
Activity: Telecom treasure hunt
Duration : 1h
Format : Group work
Group constitution : 3 to 4 persons
Assignment
Take a copy of the field notebook provided by the teacher and start to document the ICT infrastructure around the school. Come back to class after to fill the online collaborative map with your pictures and annotations. The online map will be provided by the teacher when students are coming back to class.
Ressources
Download the field notebook here.
Output
2026-2027 (Urban school)
Activity: Geopolitics of submarine cables
Duration : 15 mins
Format : Class discussion
Assignment
Take a couple of minutes to visit submarinecablemap.com and search for
- 2Africa.
- Equiano
- ALBA-1 cables
- ARIMAO
What do you notice?
Ressources
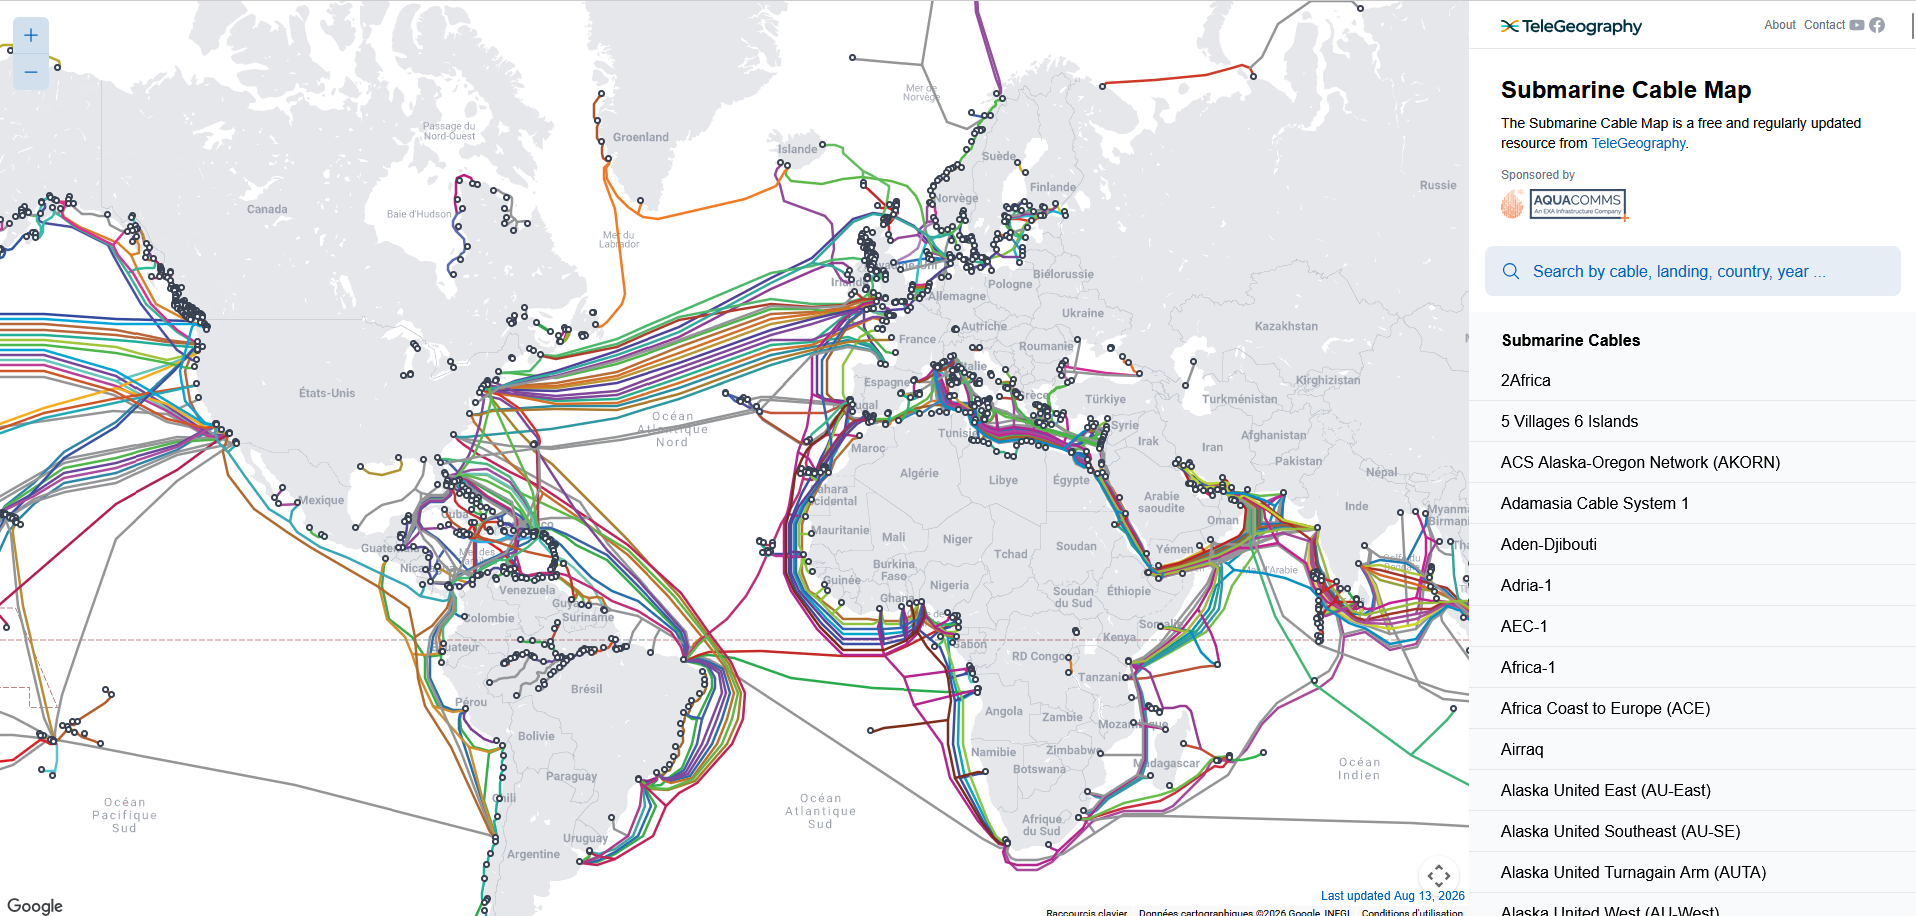
Activity : Tracing the road to google.com
Duration : 10 mins
Format : Individual activity
When you connect to another device on the internet, your request must travel through the access, aggregation and core networks until it reaches its destination. Along the way, it will encounter many devices, including your internet box, mobile access point and routers.
Traceroute is a networking tool primarily used for debugging purposes that allows you to see all the devices (hops) that your request goes through before reaching the requested address.
Assignment
Make a traceroute to google.com to see how many devices your request will pass through before reaching its destination
Ressources
Open your terminal and copy and paste the relevant command below, depending on your operating system.
MAC OS
traceroute google.com
Windows
tracert google.com
Linux
traceroute google.com
Output
Results for fixed network
traceroute to google.com (142.251.39.206), 30 hops max, 60 byte packets
 1  livebox.home (192.168.1.1)  4.548 ms  4.441 ms  4.352 ms
 2  system.cgnidf22.rbci.orange.net (193.253.76.15)  20.210 ms  20.150 ms  20.094 ms
 3  ae461-0.ncidf203.rbci.orange.net (81.253.216.18)  20.038 ms  22.084 ms  22.026 ms
 4  * * *
 5  * * *
 6  209.85.148.16 (209.85.148.16)  29.244 ms 193.251.255.48 (193.251.255.48)  16.322 ms 193.251.255.82 (193.251.255.82)  16.234 ms
 7  * 108.170.238.45 (108.170.238.45)  15.780 ms *
 8  142.250.224.196 (142.250.224.196)  17.264 ms 142.251.253.39 (142.251.253.39)  15.570 ms 142.251.253.37 (142.251.253.37)  17.036 ms
 9  pnpara-ai-in-f14.1e100.net (142.251.39.206)  23.985 ms  23.934 ms  23.885 ms
Datacenter attractiveness
Duration : 20 mins
Format : Class discussion
Assignment
We have seen that the implementation of a data centre responds to technical and political criteria. Putting yourself in the shoes of a datacenter developer, do you think France is an attractive place for implementing a data centre?
Using the list of criteria and ressources below which you can supplement with the elements seen in class and your own knowledge, determine the advantages and limitations of France for implementing a data centre.
In addition, what can you notice about the implementation of data centres and projects by looking at [this datacentre map] (https://datacenters.hubblo.org/)?
Ressources
Criteria
| Criteria |
|---|
| Privileged access to the electricity grid (source station) |
| Privileged access to internet fibre network (backbone) |
| Low natural risks (eruptions, floods, etc.) |
| Access to cheap land |
| Low cost or preferential electricity rate |
| Tax benefits or tax reductions |
| Legal shortcuts |
| Potentially access to a water network |
| Other criteria |
Other ressources
- Map related to data centers implementation (price, carbon intensity, electricity network, backbone network, grid capacity, …): https://enersite.app/
- Most complete map of datacenter in France both in operation and in development (Hubblo) : https://datacenters.hubblo.org/
- Map of natural risk distribution in France
- Blog note on France Datacenter regulatory framework from a US law firm (Bracewell) : https://www.bracewell.com/resources/building-data-centers-in-france-navigating-regulatory-hurdles-and-unlocking-growth/
- Comparison of data center incentive schemes across Europe : https://paczyzak.substack.com/p/data-center-incentive-schemes
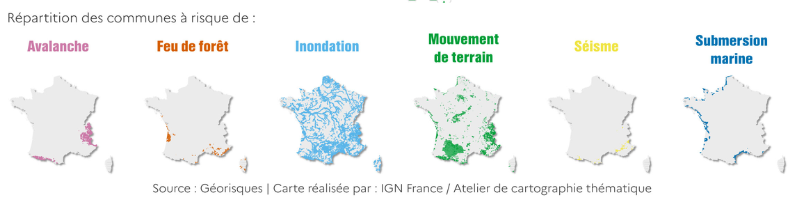
Activity: Electricity Map
Duration : 10 mins
Format : Class discussion
Assignment
Take a couple of minutes to visit Electricity Map.
What do you notice in terms of geography and temporality ?
Ressources
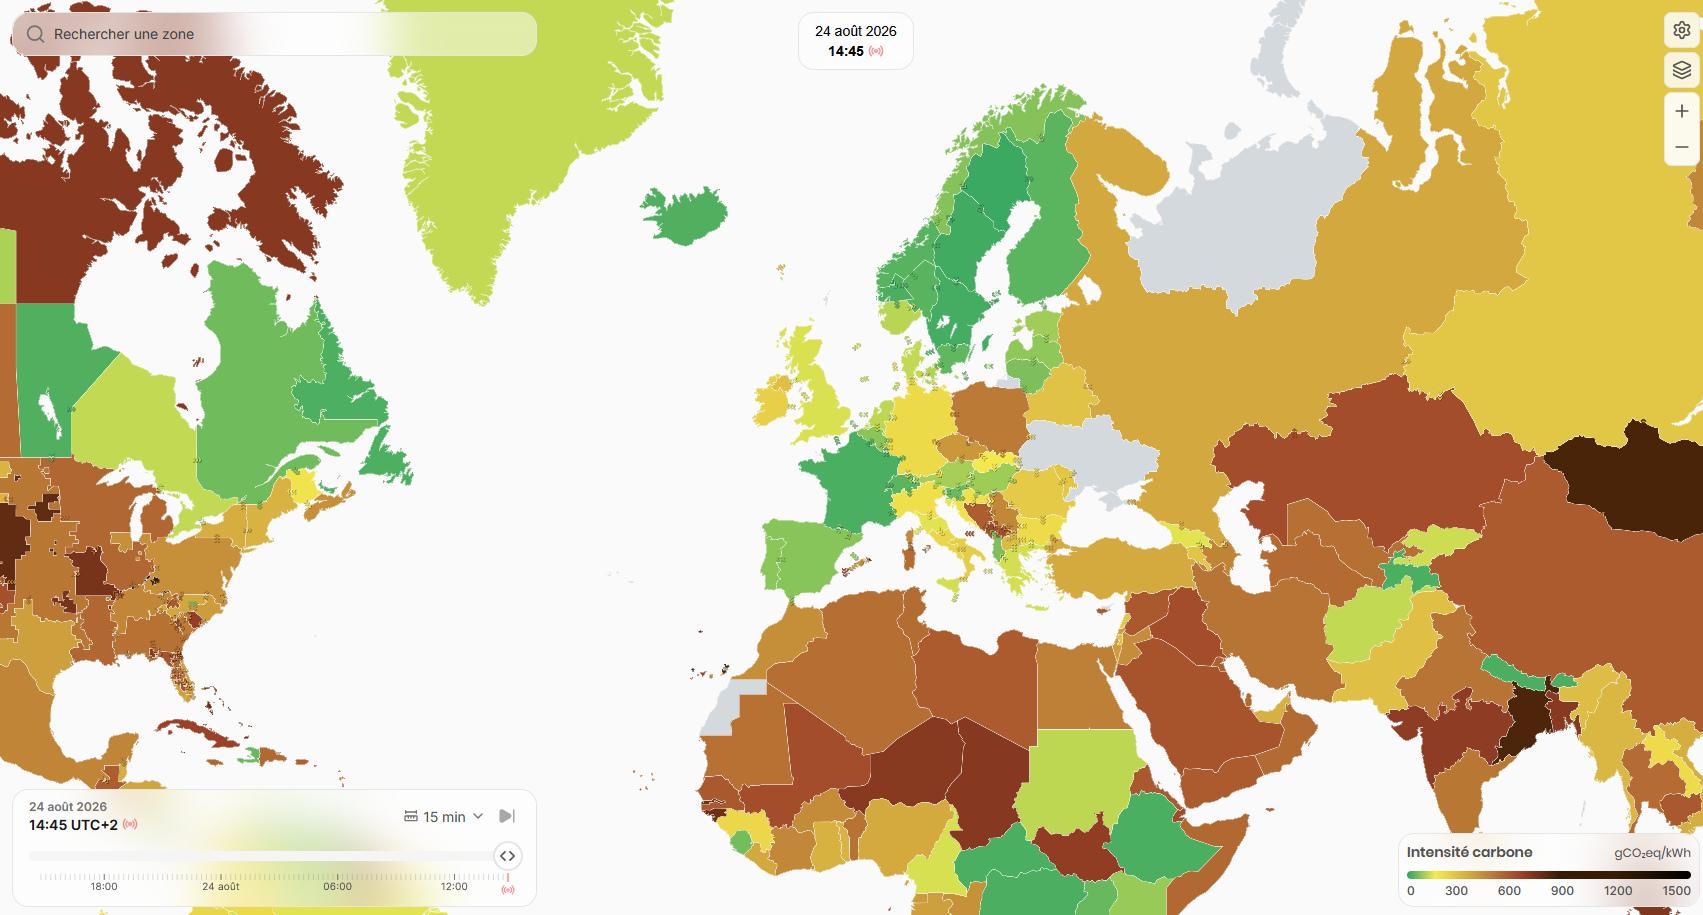
Activity: Cooling technology
Duration : 15 mins
Format : Class discussion
Assignment
Examine this communication from Microsoft and identify the various cooling technologies they used. In terms of geography, what trends can you identify in their choice of cooling technology?
Ressources
Dismantlement of digital devices
Duration : 1h
Format : Group work
Group constitution : 3 to 4 persons
Assignment
Take apart the device provided by the teacher. Using the resources below and your own online research, try to determine its composition (metals, plastics, glass, etc.).
Ressources


Activity: The carbon footprint of an e-mail
Duration : 1h
Format : Group work
Group constitution : 3 to 4 persons
Assignment
You are a consultant specializing in the environmental impact assessment of digital technology. The company info2000 has asked you to assess the carbon footprint of their email services over a one-year period in order to understand how to improve the environmental footprint of their digital activities.
Ressources
End user equipments
The company has 100 employees working 35 hours per week with five weeks of paid vacation, based in France, each with a laptop on which they perform all their tasks. Employees spend an average of one hour per day sending or receiving emails, which management considers to be their most important activity. Their supplier, Dell, provided this PCF (Product Carbon Footprint) sheet.
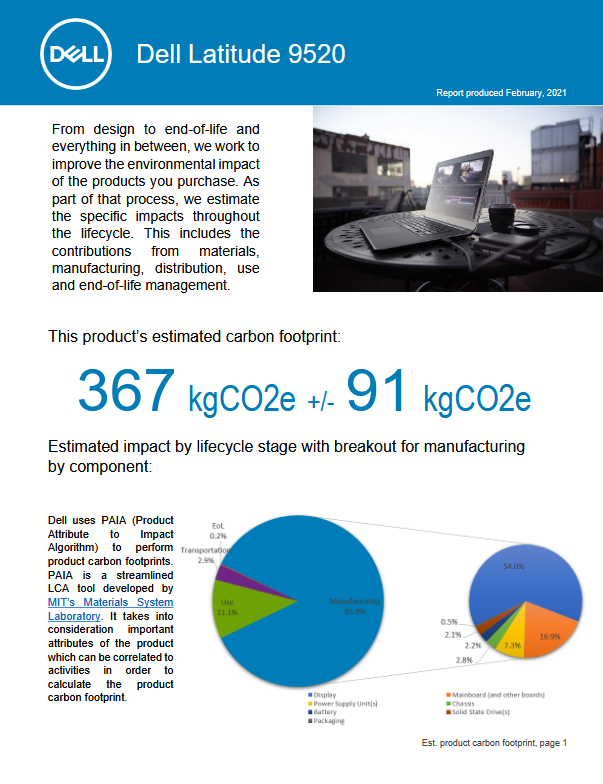
Network
The email service uses 100 GB of the 1,000 GB used annually by the company via the fiber network. Your provider, FreePro, provides you with the following regulatory method:
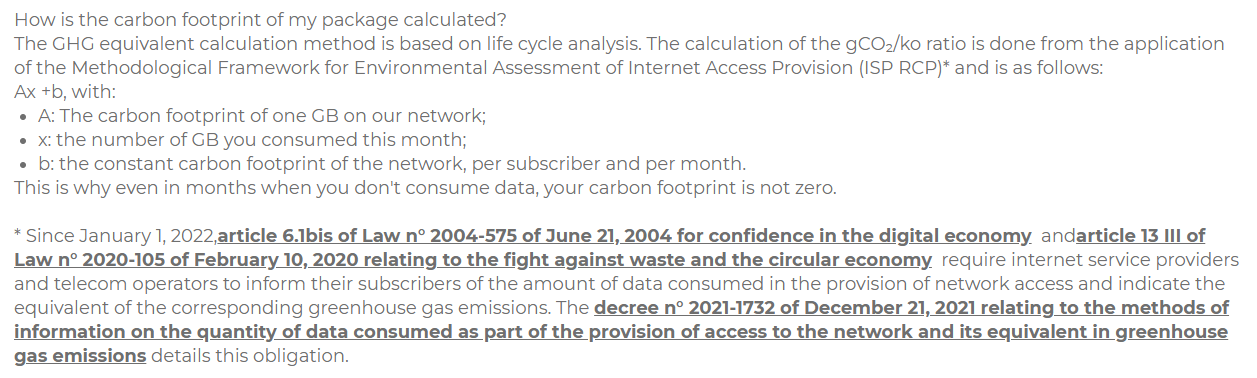
__
With the following data:
- A = 0.001 kgCO2eq./GB
- b = 20 kgCO2eq./subscriber
Datacenter
The company’s service provider is Caramail, which has a data center in France. 10% of its revenue comes from info2000, but info2000 uses 20% of the infrastructure’s capacity. The data center consumes 10 MWh annually. However, it has signed a contract (Power Purchase Agreement - PPA) with a solar power plant in India from which it purchases 100% of its electricity, which is why it reports an environmental footprint of 0 to its customers.
For simplicity, you only need to consider the impact of the data centre’s use phase (i.e. don’t consider the impact of acquiring raw materials, manufacturing, distribution or end of life).
Other elements
- The average carbon footprint in France per MWh is 50 kg CO₂eq.
- You do not have to use all of the elements presented in the instructions.
- Calculate the impact separately for laptops, the network, and the data center.
- There are no right or wrong answers, as long as you justify your choices.
Activity : Net environnmental impacts of a solution
Duration : 45 mins
Format : Class discussion
Today, there is an effort to improve the methodology for defining avoided emissions, thanks in particular to digitisation. These include the ITU-T L.1480 standard, the European EGDC methodology (under construction) and Carbone 4’s Net-Zero Initiative for IT. These documents have come to light because the way in which avoided emissions are defined has so far been very confused, leading sometimes to false claims.
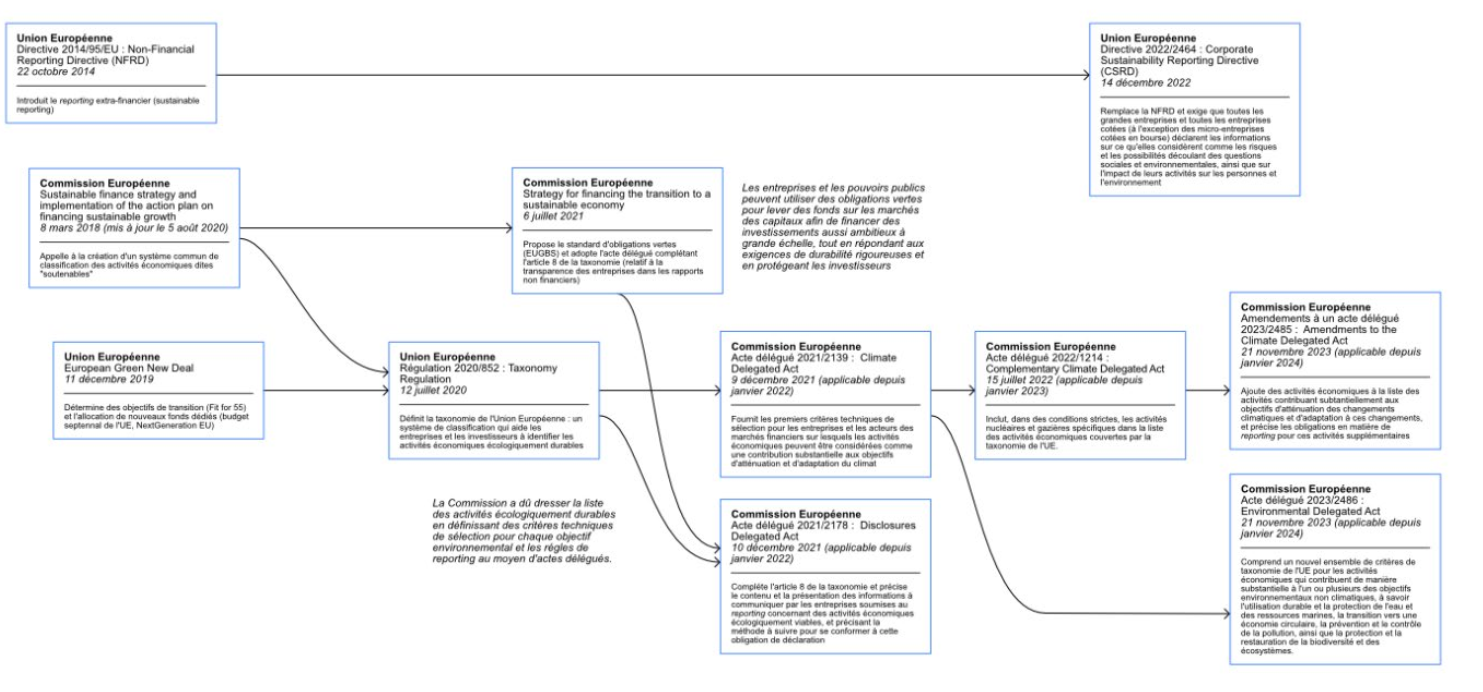
Because ecological transition policies are still largely underfunded, estimating avoided emissions is now of strategic interest, as proving that one is helping to decarbonise other sectors will give access to preferential financing and attract new investment. For instance, the european taxonomy on sustainable economic activities includes data-driven solutions for GHG emissions reductions. It is therefore necessary to review the foundations of these methods.
Assignment
1 - Identify a digital solution
An important bias produced by the vision of avoided emissions is that it only focuses on solutions that have the potential to mitigate the environmental impact of other activities. In reality, the vast majority of digital solutions are not considered to reduce the environmental impact of other activities. Even worse, digital solutions are also used to enable economic activities that hinder the ecological transition, such as in the oil and gas industry.
Therefore, selecting a solution to study is a significant decision that is often biased, particularly in the context of organisations that wish to claim avoided emissions. Some methods recommend stating the share of revenue produced by the analysed solution to provide context for the potential avoided impact in relation to the organisation’s overall activity.
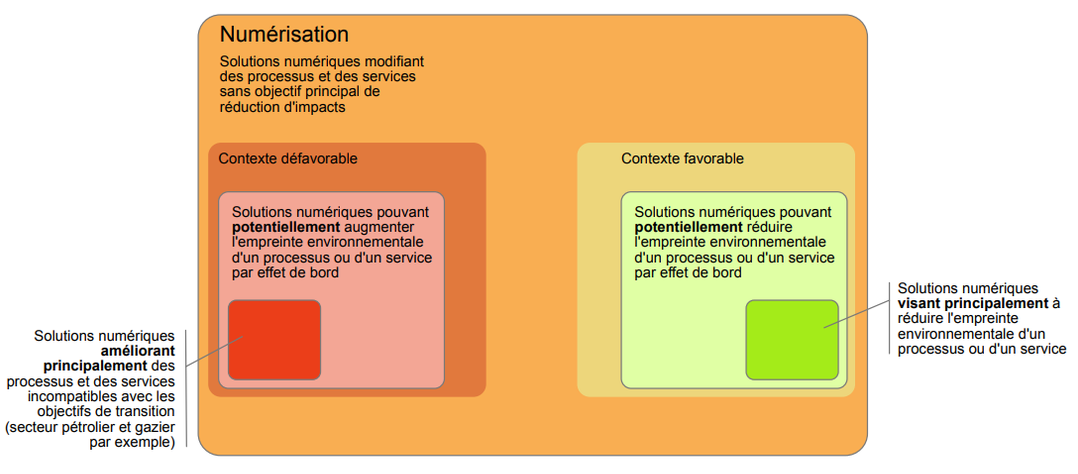
Important
Select a digital solution that as potential to reduce the impacts of an activity
2 - Study the context of implementation
A digital solution never has an impact on its own. It is always the combination of the solution and the context in which it is implemented that creates an effect. For instance, introducing a carpooling app in a city with significant policies favouring this activity, such as economic incentives and infrastructure, will not have the same effect as in a city with no such policies.
Several types of contextual parameter could be important:
- Local policy
- Weather/climate
- Topography
- Energy sources
- State of the infrastructure
- Shape of production
- Shape of consumption
- Transition plan
Important
Select the intended deployment context and identify the main contextual parameter that could influence the solution
3 - Choose a reference scenario
Unlike other activities such as carbon capture or reforestation, digital solutions never remove environmental impacts in a physical sense. In reality, digital solutions can reduce the emissions of an activity in an accounting sense. Indeed, avoided emissions are always avoided in comparison to a reference scenario, which is a hypothetical situation in which the solution hasn’t been deployed. In reality, it is impossible to determine with certainty the “what if” scenario. Therefore, choosing a reference scenario, which influences the final result, is subject to political vision.
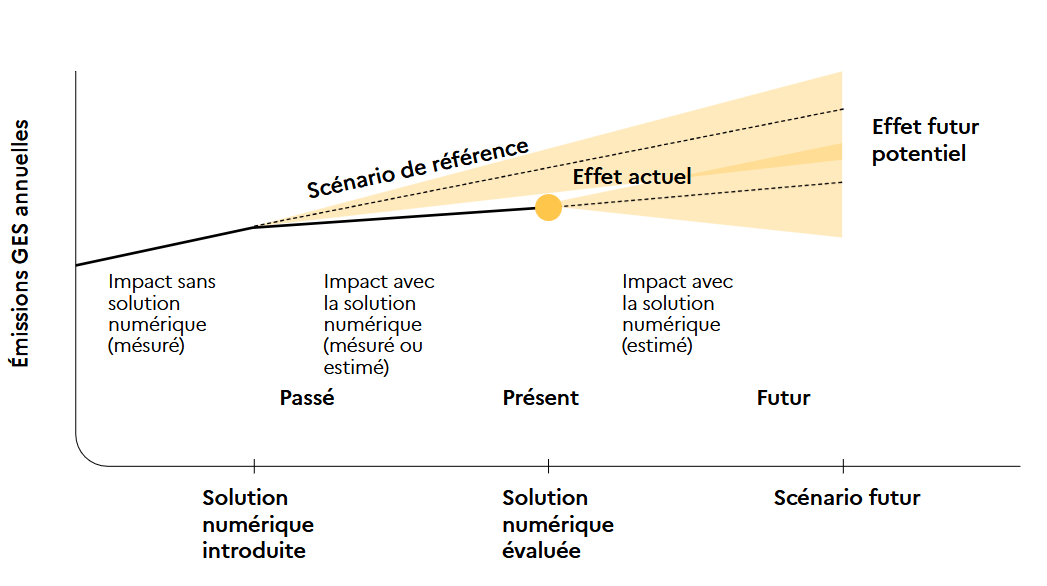
Various categories of reference scenario can be selected. We illustrate these with the example of replacing an oil-fired boiler with a connected heat pump.
- The “status quo” scenario : Oil-fired boiler
- The “market average” scenario : Average heating solution on the market
- The “regulation” scenario : Minimum solution required by regulations at the time of replacement
- The “control sample” scenario : Chosen based on the results of the control sample
- The ‘alternative’ or “low-tech” scenario : Reduction in average temperature or reduction in heating surface area
Important
Select the most relevant reference scenario against which the effects of the solution will be measured.
4 - Identify the directs and indirects effects of the solution
The most recent methodologies for assessing the net impact of digital technologies suggest using a consequence tree to map the effects of implementing a digital technology, from the most direct to the most indirect.
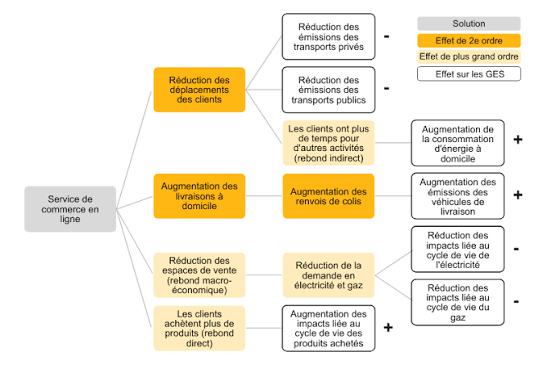
Important
Map the indirect effects of the solution using a consequence tree.
5 - Quantitatively assess the environmental impact of these effects
The final part is often the most difficult and subject to the most uncertainty. It involves assessing quantitatively the environmental impacts of each identified effect, whether positive or negative, and then summarising all impacts to yield the net impacts of the solution.
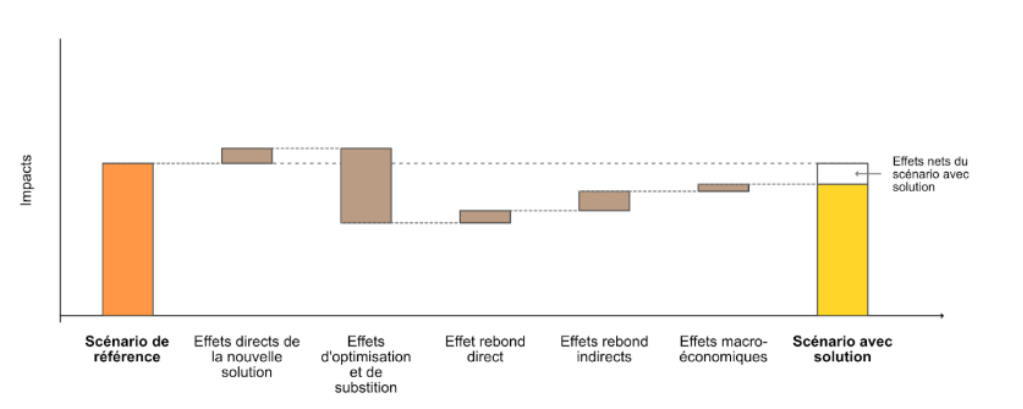
Important
Quantitative assessments of indirect effects are beyond the scope of this course.
Evaluation
Collective project #1 : Datacenter environmental inquiry
Project goal
The two collective projects aim to develop your understanding of environmental policy planning in the context of the deployment of digital infrastructures and technologies. Throughout the projects, you will focus on a specific city. In this first project, you will analyse the environmental challenges involved in setting up a data centre. For the second project, you will examine the impact of a particular technology, such as smart meters or car sharing, in the same city.
Assignment
You are civil servants being asked to deliver a recommendation for the city council and the mayor. Your analysis will help the city refuse, transform or accept the deployment of a given datacenter.
- Assess the environmental challenges (present and future) and transition policies of the city assigned to your group by the teacher.
- Assess the environmental challenges of the implementation of the data centre assigned to your group.
Step 1 : Environmental transition of your city
- Make groups of 4 people
- Each group will be assigned a city
- Assess climate and environmental challenges in your city (today 2020 to 2050)
- Write a summary of your findings
Ideas of data to collect
- Water availability
- Water withdrawal/consumption
- Water conservation targets
- Electricity still available
- Electricity mix (current final energy mix, current electricity mix)
- Energy transition targets
- Heat generation technologies
- Land use
- Air pollution
- Biodiversity
- Climate risks in the city (present and future) : droughts, heatwaves, flooding, etc
Datasource
- Transition plan / Net zero carbon / low carbon roadmap of cities
- Scientific literature (using right keywords in search engine such as Semantic Scholar or equivalent)
- IPCC reports and tools
- External analysis from consultancy groups, NGOs, etc.
- Maps, geographical data, statistics, etc.
Step 2 : Environnemental challenges of your datacenter
- Each group will be assigned a data centre in their city.
- Describe the potential environmental challenges of this data centre (electricity consumption, water issues, gas leaks, heat production, land use, conflicts of use, etc.).
- Assess these challenges in relation to your city’s environmental challenges and policy.
- Critically examine the measures taken (or not taken) by the data centre provider.
Ideas of data to collect
- Picture of the data center using satellite imagery
- Electricity reservation
- Cooling technology
- Water use
- Land use
- Political and fiscal incentive/discouragement
WARNING —> Each data point needs to be sourced (only primary source allowed)
Datasource
- Data centers session
- Satellite image : Google Map / Yandex Map / World Imagery Wayback / Open Street Map
- Official communication from the datacenter provider
- Newspaper articles
- External analysis from consultancy groups, NGOs, etc.
- Maps, geographical data, statistics, etc.
Outcome
Your assessment should take the form of a short report (around 5 pages). In addition to the text, you are invited to add various media to your summary (maps, graphs, images, etc.).
Deadline for the School of Public Affairs : 10th of november 12pm
Deadline for the School of Urbanism : TBD
Assessment grid
| Criteria | Point |
|---|---|
| The city’s most relevant environmental challenges and policies have been identified. | 3 |
| The most relevant environmental challenges facing the data centre have been identified. | 5 |
| A relevant link has been established between the environmental challenges facing the city and the data centre. | 4 |
| The students have engaged in critical analysis of the communications from data centre providers. | 4 |
| The students were able to formalise an informed opinion on the relevance of the infrastructure in the city. | 2 |
| Clarity and structure of the document. | 2 |
| Total | 20 |
Collective project #2 : Indirect effects inquiry
Project goal
The two collective projects aim to develop your understanding of environmental policy planning in the context of the deployment of digital infrastructures and technologies. Throughout the projects, you will focus on a specific city. For the first project, you analysed the environmental challenges associated with setting up a data centre. For the second project, you will examine the direct and indirect environmental effects of deploying a specific technology, such as smart meters or car-sharing schemes, in the same city.
Assignment
You are civil servants tasked with delivering a recommendation to the city council and the mayor. Your analysis will help the city decide whether to reject, modify, or support the deployment of a given technology.
You will conduct a qualitative assessment of the direct and indirect environmental effects of the digital technology assigned to your group by the teacher.
You will build on the analysis of environmental and climate risks and transition policies developed for your assigned city during the previous collective project.
- Stay in the same group as last collective project
- Each group keep the same city
- Apply the protocole seen in the net impacts assessment activity
Method
1 - Identify a digital solution
2 - Study the context of implementation
3 - Choose a reference scenario
4 - Identify the directs and indirects effects of the solution and represent them in a consequence tree
Datasources
- The teacher will give to each group a relevant research paper as a starter to constitute a quick literature review
- Additional scientific literature (using right keywords in search engine such as Semantic Scholar or equivalent)
- External analysis from consultancy groups, NGOs, etc.
- Industry reports
Outcome
Your assessment should take the form of a 15 mins presentation that you will deliver during last session.
Deadline : Last session
Assessment grid
| Criteria | Points |
|---|---|
| The choice of the solution has been justified | 1 |
| The choice of the reference scenario has been justified | 1 |
| A complete view of the implementation context has been presented | 2 |
| The most relevant direct and indirect effects have been identified and defined | 5 |
| A clear causal representation of the effects of the technology is presented (e.g., consequence tree) | 1 |
| A relevant link has been established between the environmental effects of the technology and the environmental challenges of the city | 3 |
| The students were able to formulate an informed opinion on the relevance of deploying the technology in the city | 3 |
| Clarity and structure of the presentation | 2 |
| Distribution of speaking time among students | 2 |
| Total | 20 |
Individual essay
Project goal
As part of this individual assignment, you will be asked to answer the following question:
What have I taken away from this class?
This essay aims to encourage you to step back and reflect on the ecological challenges associated with the digital transition and how they were addressed throughout the course. You may also offer a critical and reasoned perspective on some of the approaches discussed or used in the course, particularly where you found them relevant or open to debate.
The structure of the essay is flexible.
Outcome
Your assessment should take the form of a individual essay (maximum 2 pages).
Deadline : TBD
Evaluation grid
| Criteria | Point |
|---|---|
| The student was able to demonstrate a good understanding of the interrelated challenges of ecological and digital transition seen in class. | 8 |
| The student was able to provide a well-argued perspective on several aspects of the intersecting issues of ecological and digital transition seen in class. | 8 |
| Clarity and structure of the document. | 4 |
| Total | 20 |